16 KiB
orx-color
Color spaces, palettes, histograms, named colors.
Color presets
orx-color adds an extensive list of preset colors to ColorRGBa. Check sources for a listing of the preset colors.
Color histograms
orx-color comes with tools to calculate color histograms for images.
val histogram = calculateHistogramRGB(image)
val colors = histogram.sortedColors()
Color sequences
Easy ways of creating blends between colors.
Using the rangeTo operator:
for (c in ColorRGBa.PINK..ColorRGBa.BLUE.toHSVa() blend 10) {
    drawer.fill = c
    drawer.rectangle(0.0, 0.0, 40.0, 40.0)
    drawer.translate(0.0, 40.0)
}
Or blends for multiple color stops using colorSequence. Blending takes place in the colorspace of the input arguments.
val cs = colorSequence(0.0 to ColorRGBa.PINK,
        0.5 to ColorRGBa.BLUE,
        1.0 to ColorRGBa.PINK.toHSLUVa()) // <-- note this one is in hsluv

for (c in cs blend (width / 40)) {
    drawer.fill = c
    drawer.stroke = null
    drawer.rectangle(0.0, 0.0, 40.0,  height.toDouble())
    drawer.translate(40.0, 0.0)
}
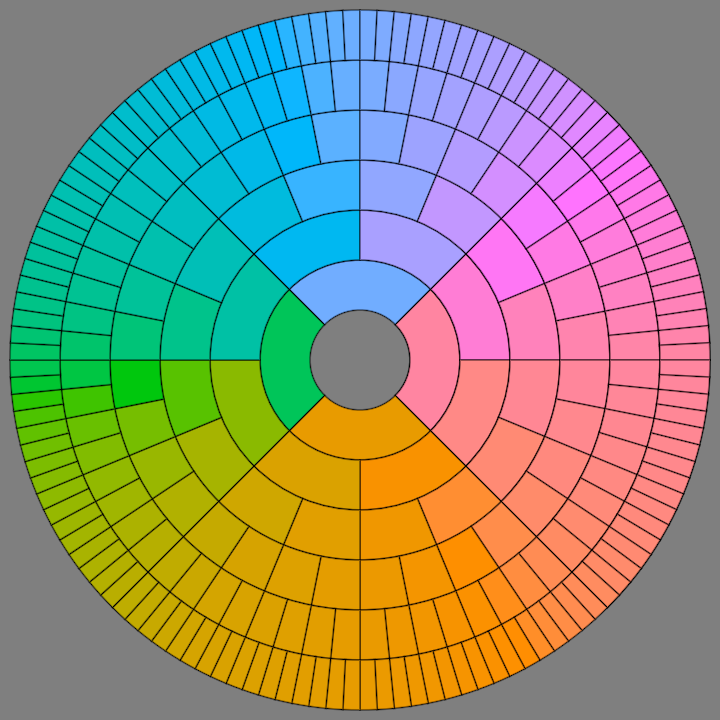
HSLUVa and HPLUVa colorspaces
Two color spaces are added: ColorHSLUVa and ColorHPLUVa, they are an implementation of the colorspaces presented at hsluv.org
Demos
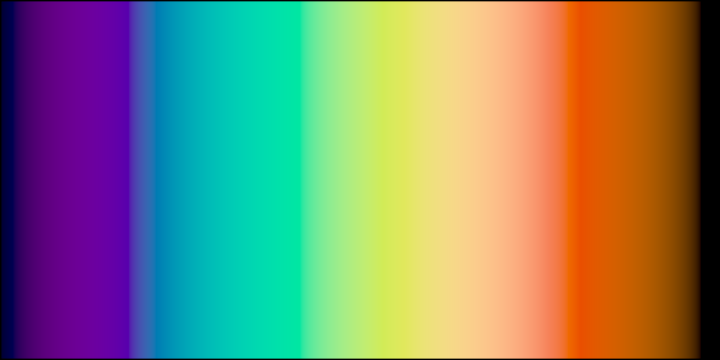
colormap/DemoSpectralZucconiColormap
This program demonstrates the spectralZucconi6() function, which
takes a normalized value and returns a ColorRGBa using the
accurate spectral colormap developed by Alan Zucconi.
It draws a varying number of vertical bands (between 16 and 48) filled with various hues.

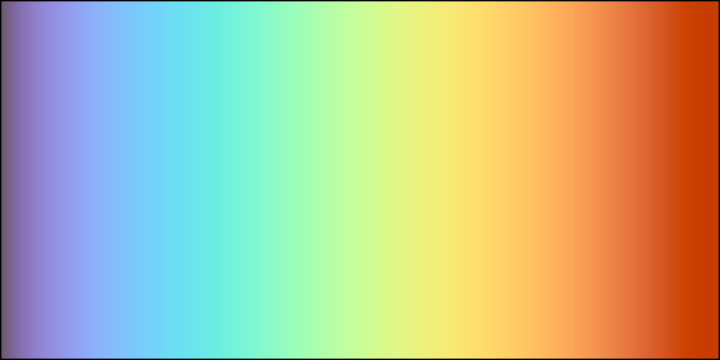
colormap/DemoSpectralZucconiColormapPhrase
This program demonstrates how to use the shader-based version of
the spectral_zucconi6() function, which
takes a normalized value and returns an rgb color using the
accurate spectral colormap developed by Alan Zucconi.
It shades a full-window rectangle using its normalized x coordinate
in a ShadeStyle to choose pixel colors.
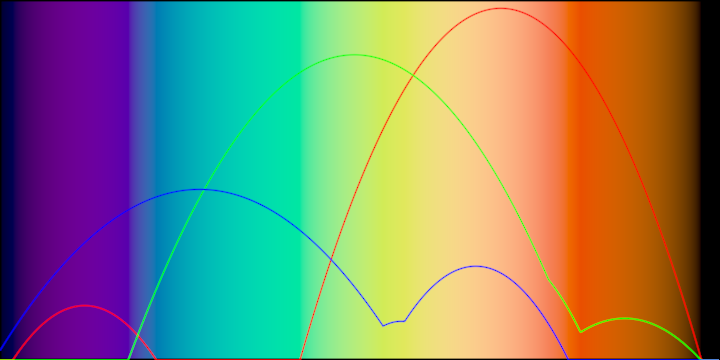
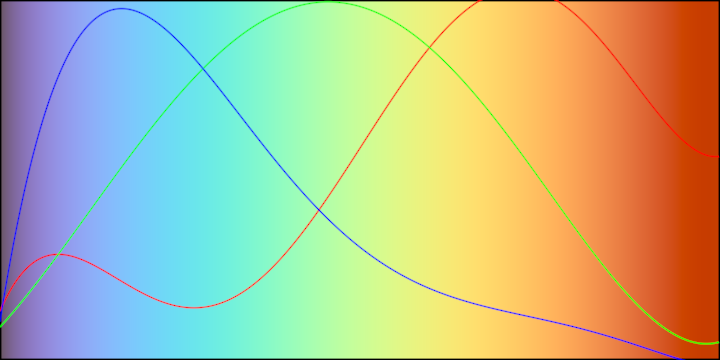
colormap/DemoSpectralZucconiColormapPlot
This demo uses the shader based spectral_zucconi6() function to fill the background,
then visualizes the red, green and blue components of the colors used in the background
as red, green and blue line strips.
The Vector2 points for the line strips are calculated only once when the program starts.
colormap/DemoTurboColormap
This program demonstrates the turboColormap() function, which
takes a normalized value and returns a ColorRGBa using the
Turbo colormap developed by Google.
It draws a varying number of vertical bands (between 16 and 48) filled with various hues.

colormap/DemoTurboColormapPhrase
This program demonstrates how to use the shader-based version of
the turbo_colormap() function, which
takes a normalized value and returns an rgb color using the
Turbo colormap developed by Google.
It shades a full-window rectangle using its normalized x coordinate
in a ShadeStyle to choose pixel colors.
colormap/DemoTurboColormapPlot
This demo uses the shader based turbo_colormap() function to fill the background,
then visualizes the red, green and blue components of the colors used in the background
as red, green and blue line strips.
The Vector2 points for the line strips are calculated only once when the program starts.
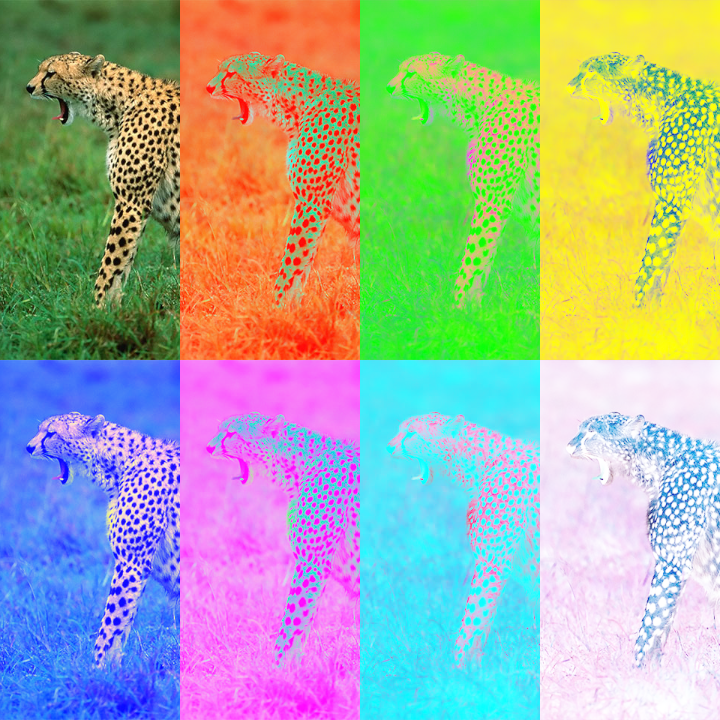
colormatrix/DemoColorMatrix01
This demo modifies the displayed image in each grid cell using color matrix transformations to demonstrate color channel inversions based on the grid cell's index. The image is adjusted to fit within each grid cell while maintaining alignment.
Functionality:
- Loads an image from the specified file path.
- Splits the drawing area into an evenly spaced 4x2 grid.
- Applies different color matrix inversions (red, green, blue) based on the position index.
- Fits the image into each grid cell while providing horizontal alignment adjustments.
colormatrix/DemoColorMatrix02
This demo modifies the displayed image in each grid cell using color matrix transformations to demonstrate color channel inversions based on the grid cell's index. The image is adjusted to fit within each grid cell while maintaining alignment.
Functionality:
- Loads an image from the specified file path.
- Splits the drawing area into an evenly spaced 4x2 grid.
- Applies different color matrix inversions (red, green, blue) based on the position index.
- Fits the image into each grid cell while providing horizontal alignment adjustments.
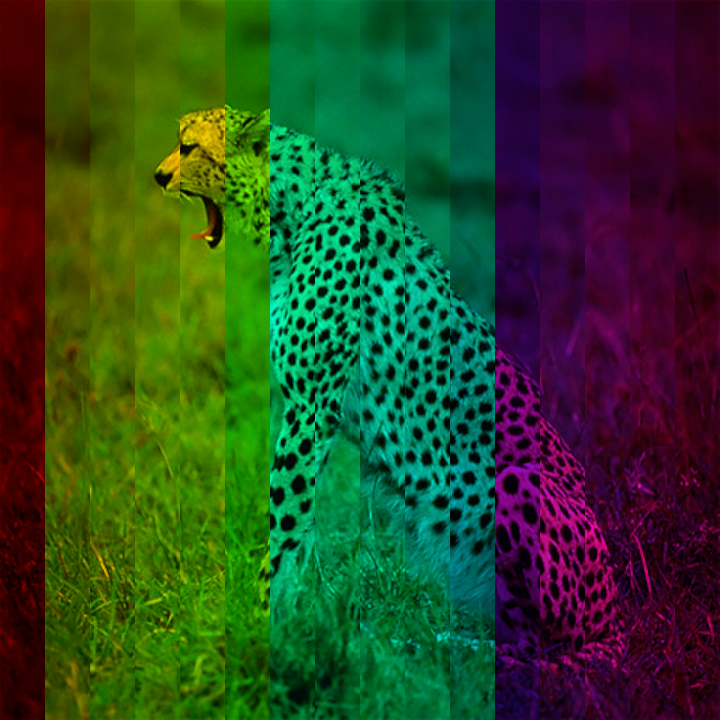
colormatrix/DemoColorMatrix03
Entry point for an application demonstrating the use of color matrix transformations on an image.
The program initializes a graphical application with a resolution of 720x720 pixels and processes an image to display it in a series of grid cells, applying a hue shift transformation based on the index of each cell.
Key features:
- Loads an image from a specified file path.
- Configures the drawing area to consist of a horizontal grid with 16 cells.
- Applies a color tint transformation utilizing the red channel, shifting its hue progressively per cell index to create a colorful gradient effect.
- Adjusts the positions of the images within each grid cell for aesthetic alignment.

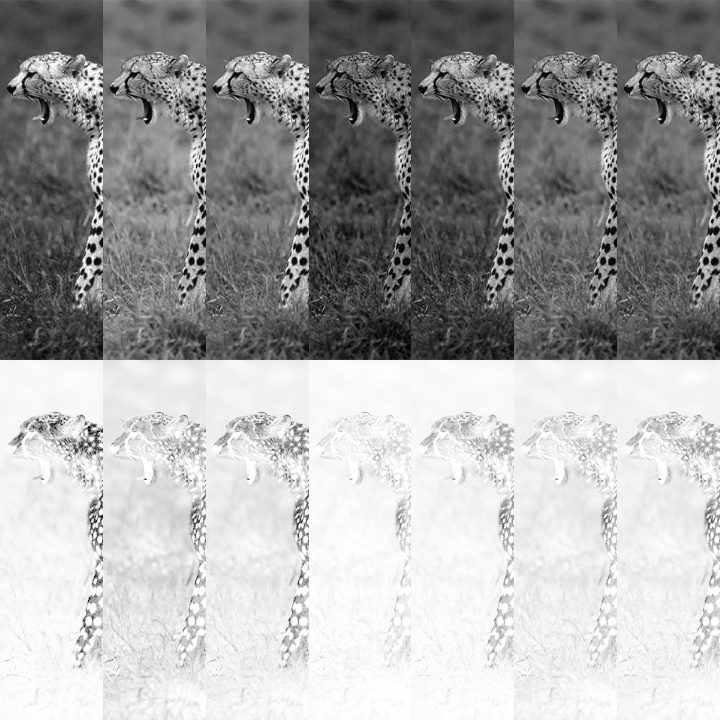
colormatrix/DemoColorMatrix04
Entry point of a graphical application that demonstrates the use of color matrix transformations on an image displayed within a grid layout.
Overview:
- Initializes a window with a resolution of 720x720 pixels.
- Loads an image from the specified file path.
- Splits the drawing canvas into a 7x1 grid of cells.
- In each grid cell, applies custom grayscale transformations to the image using a color matrix. The grayscale transformation coefficients for red, green, and blue channels are computed based on the index of the grid cell.
- Displays the adjusted image in each grid cell with horizontal alignment modifications to position the images dynamically based on their index within the grid.
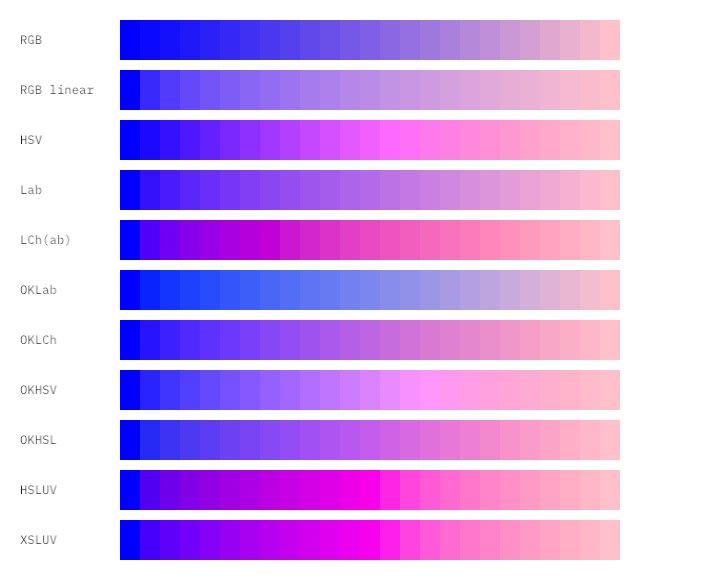
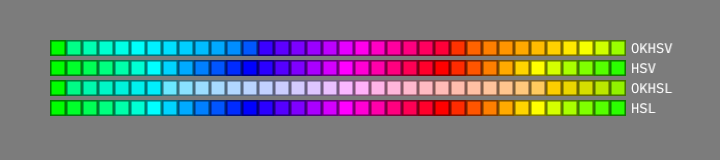
colorRange/DemoColorRange01
Comparison of color lists generated by interpolating from
PINK to BLUE in six different color spaces.
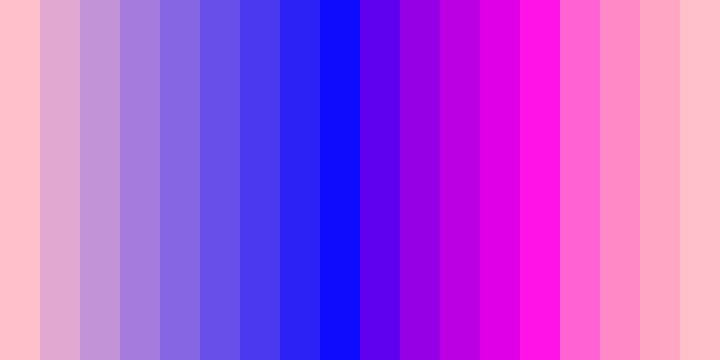
colorRange/DemoColorRange02
Demonstrates how to create a ColorSequence containing three colors, one of them in the HSLUV color space.
Each color in the sequence is assigned a normalized position: in this program, one at the start (0.0), one in the middle (0.5) and one at the end (1.0).
The ColorSpace.blend() method is used to get a list with 18 interpolated ColorRGBa colors,
then those colors are drawn as vertical rectangles covering the whole window.
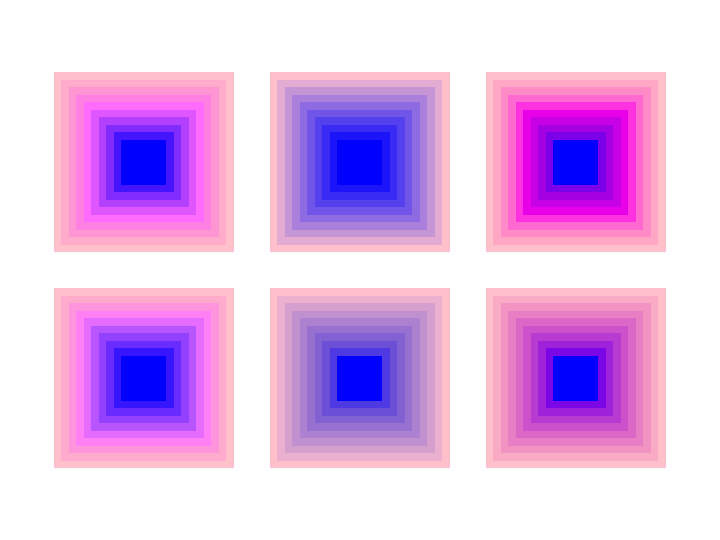
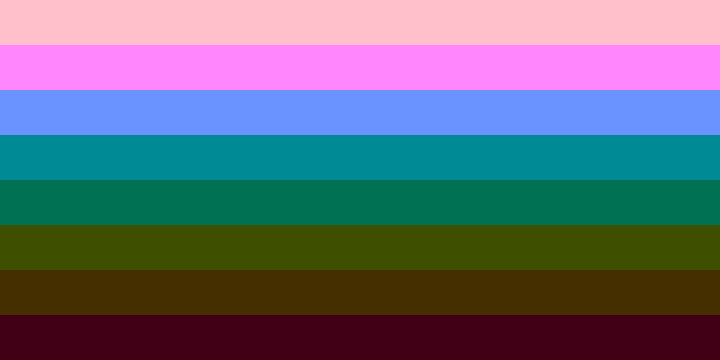
colorRange/DemoColorRange03
This program creates color interpolations from ColorRGBa.BLUE to
ColorRGBa.PINK in 25 steps in multiple color spaces.
The window height is adjusted based on the number of interpolations to show.
The resulting gradients differ in saturation and brightness and apparently include more
BLUE or more PINK depending on the chosen color space.
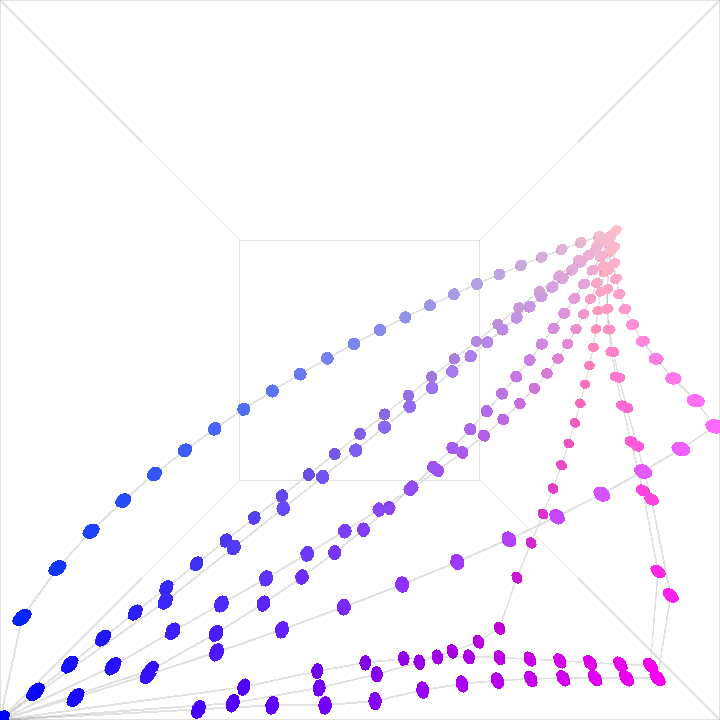
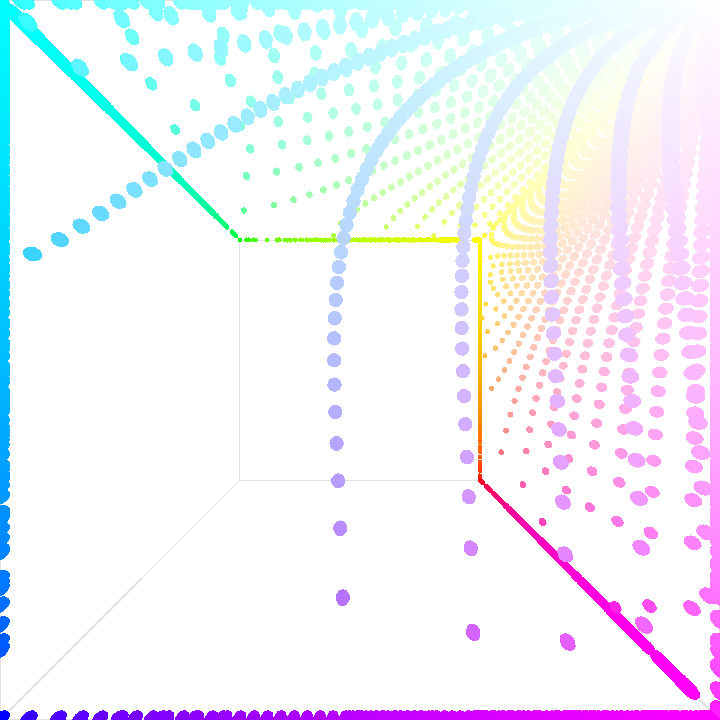
colorRange/DemoColorRange04
A visualization of color interpolations inside a 3D RGB cube with an interactive 3D Orbital camera.
The hues of the source and target colors are animated over time.
The color interpolations are shown simultaneously in nine different color spaces, revealing how in each case they share common starting and ending points in 3D, but have unique paths going from start to end.
By rotating the cube 90 degrees towards the left and slightly zooming out, one can appreciate how one of the points moves along the edges of the cube, while the other moves on the edges of a smaller, invisible cube.
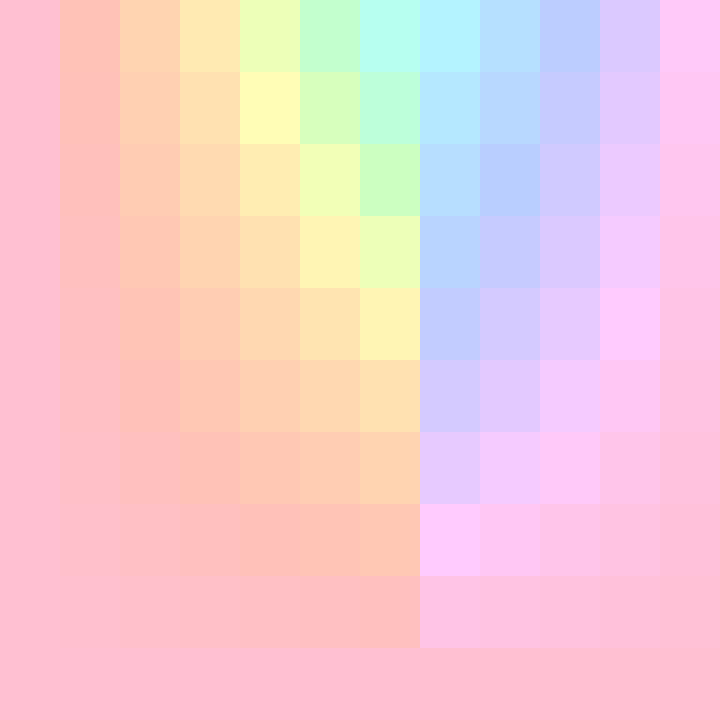
DemoColorPalette01
Demonstrates the creation of color palettes using various available methods
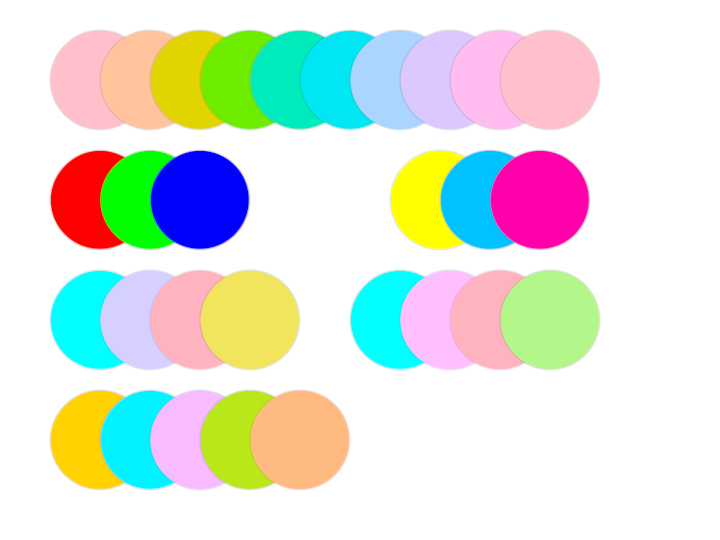
DemoColorPalette02
By default, generated palettes contain colors of varying hue but similar brightness and saturation. Here we alter the brightness of each color using .shade() for an increased dynamic range.
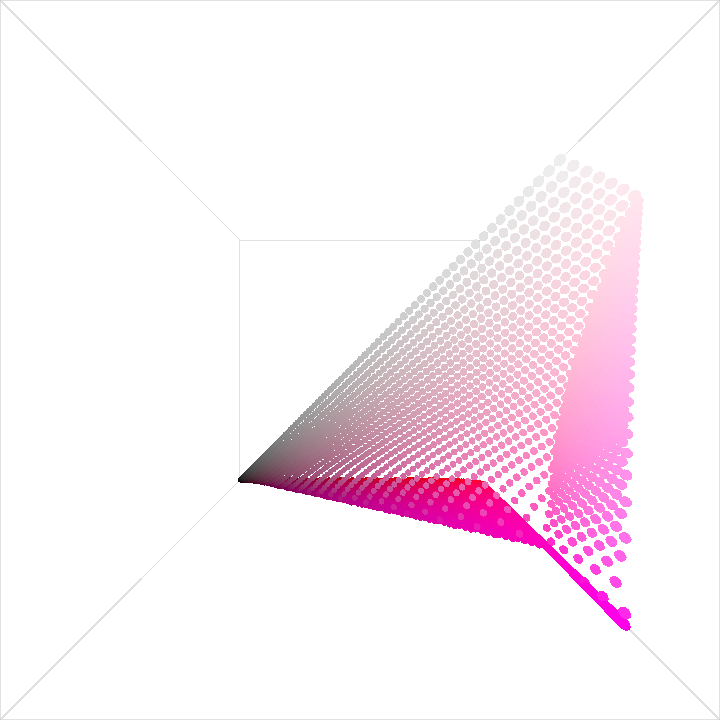
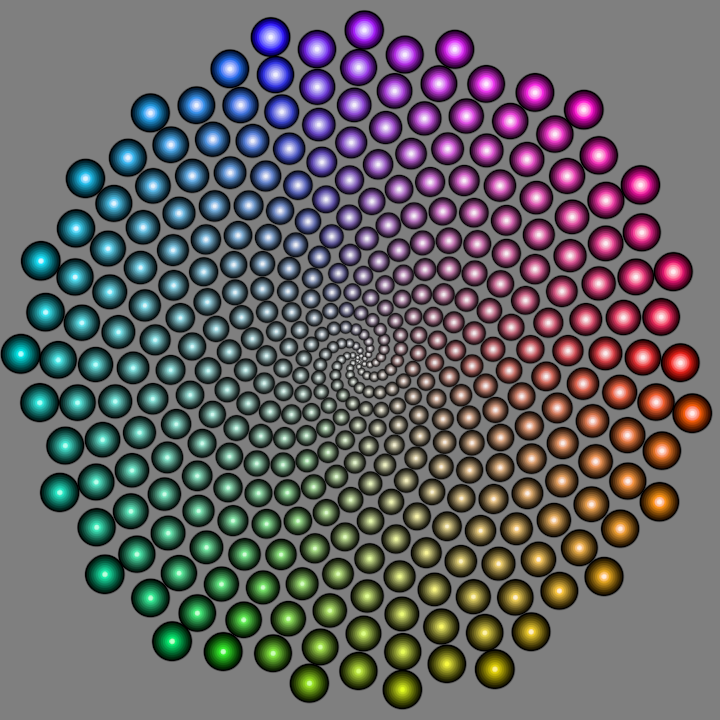
DemoColorPlane01
Visualizes a plane of ColorOKLCH colors as small 3D spheres inside a 3D box. The plane represents all available hues and chromas. The luminosity used to create the colors is modulated over time with a slow sine wave. Instanced rendering is used to render 90 x 100 colored spheres, each with a unique position based on the RGB components of the color.
Since the OKLCH color space is larger than the RGB space, some spheres would be outside the 3D box, but they are actually clipped to the walls.
DemoColorPlane02
DemoColorSequence01
A demo that demonstrates 3D objects with custom shading and color gradients.
The application setup involves:
- Configuring the application window dimensions.
- Creating a color gradient using
ColorSequenceand converting it to aColorBufferfor shading purposes. - Defining a 3D sphere mesh with specified resolution.
The rendering process includes:
- Setting up an orbital camera extension to provide an interactive 3D view.
- Applying a custom fragment shader with a palette-based shading style.
- Rendering a grid of 3D spheres, each transformed and rotated to create a dynamic pattern.
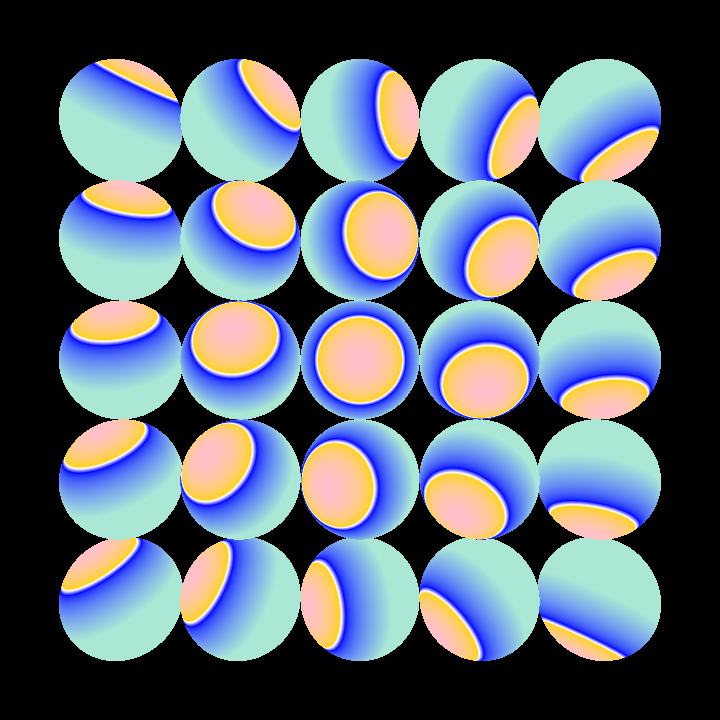
DemoDeltaE
DemoFettePalette01
DemoFettePalette02
DemoHSLUV01
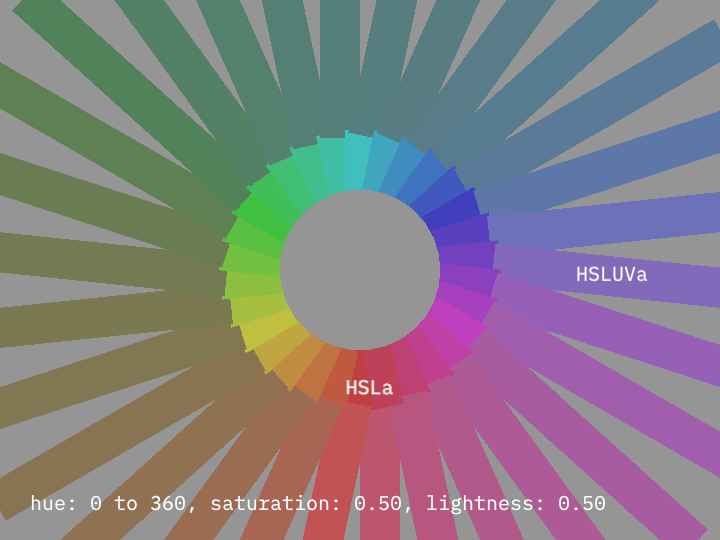
DemoHSLUV02
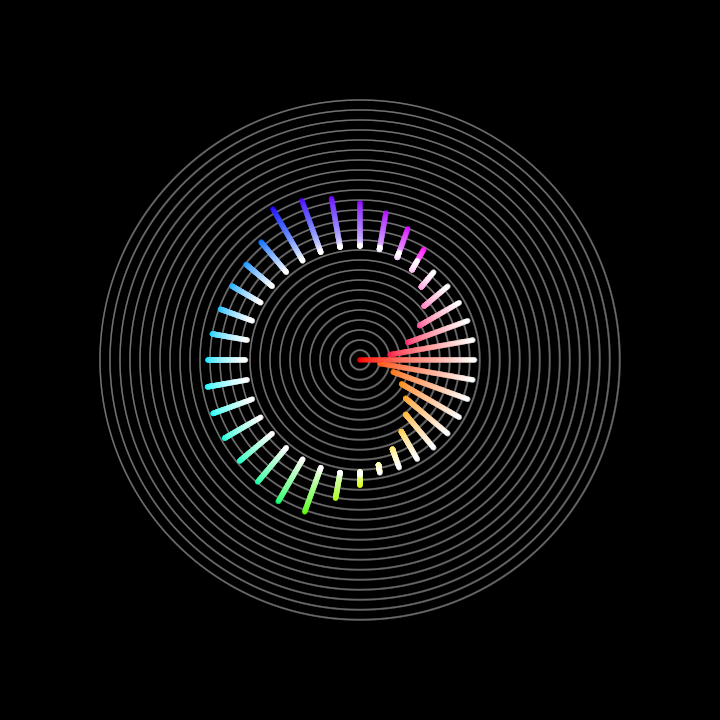
DemoHueTools01
DemoMixSpectral01

DemoOKHSV01
DemoXSLUV01
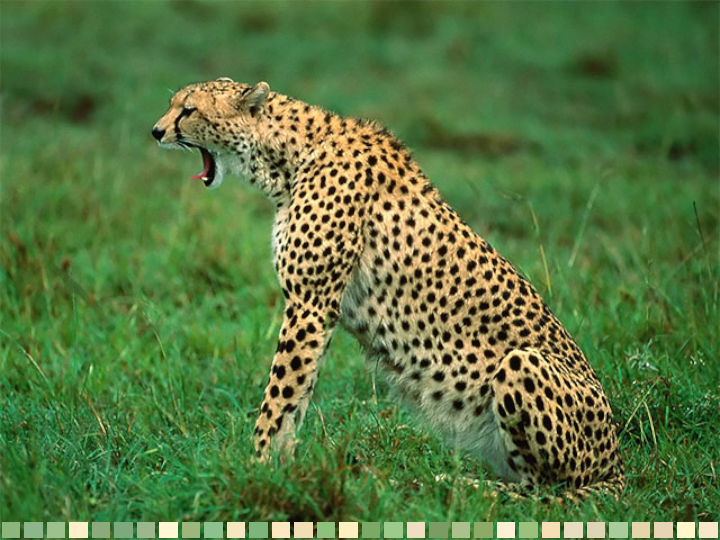
histogram/DemoHistogram01
Demonstrates how to generate a palette with the top 32 colors of a loaded image, sorted by luminosity. The colors are displayed as rectangles overlayed on top of the image.
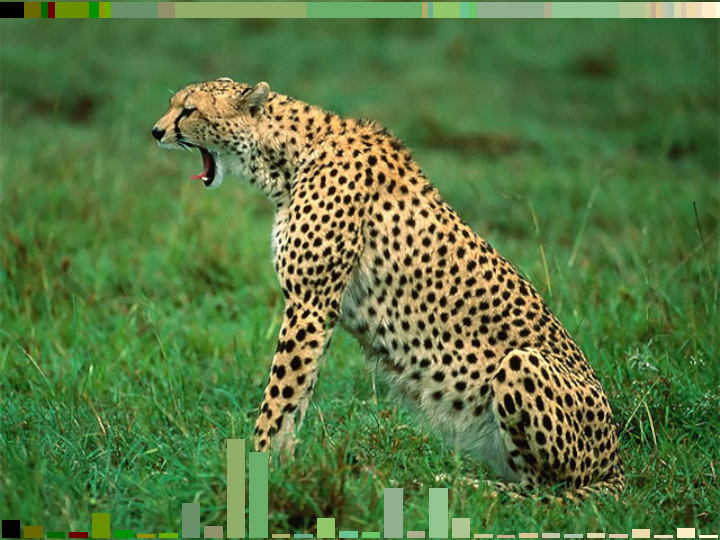
histogram/DemoHistogram02
Show the color histogram of an image using non-uniform weighting, prioritizing bright colors.
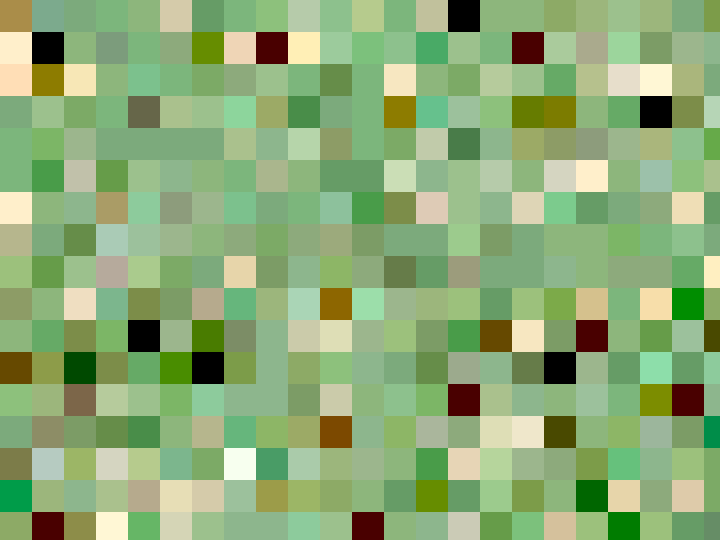
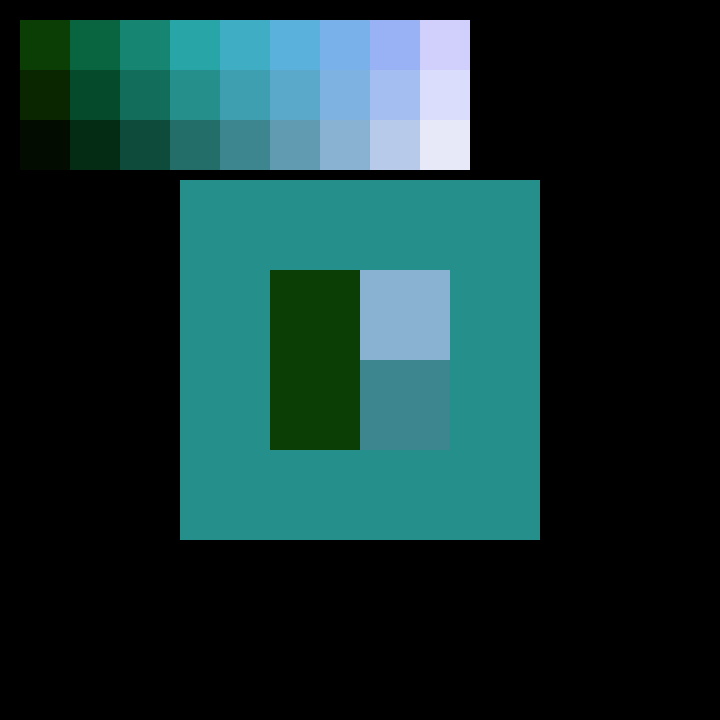
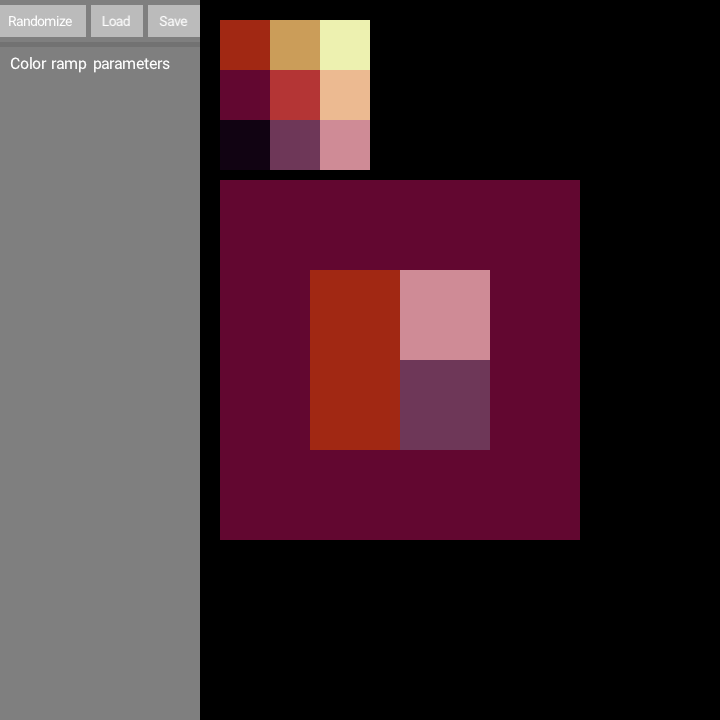
histogram/DemoHistogram03
Create a simple grid-like composition based on colors sampled from image. The cells are 32 by 32 pixels in size and are filled with a random sample taken from the color histogram of the image.
Note: due to its random nature the resulting animation contains flickering colors.