36 KiB
orx-shapes
Collection of 2D shape generators and modifiers.
Demos
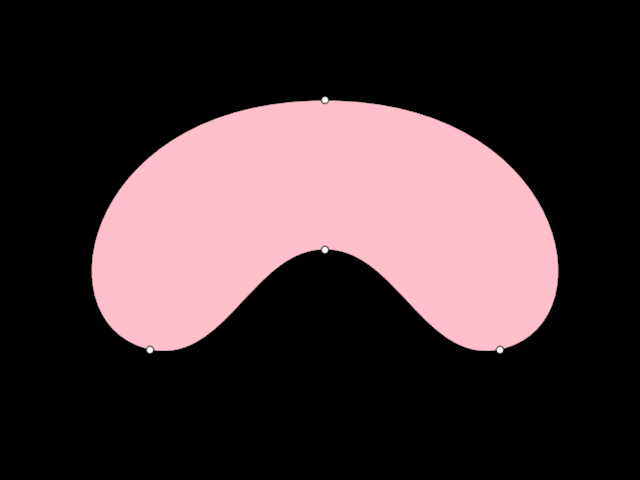
adjust/DemoAdjustContour01
Demonstrates how to use adjustContour to select and modify three vertices
in a circular contour. In OPENRNDR circles contain 4 cubic bézier
segments connecting 4 vertices.
On every animation frame the circular contour is created and transformed
using sines, cosines and the variable seconds for an animated effect.
adjust/DemoAdjustContour02
Demonstrates how to use adjustContour to select and remove vertex 0
from a circular contour, then select and animate the position and scale the new vertex 0.
adjust/DemoAdjustContour03
Demonstrates how to select and alter the edges of a rectangle.
The rectangle is a scaled-down version window bounds.
By default, the edges of a rectangular contour are linear, so the edge.toCubic() method
is called to make it possible to bend them.
Then various edges are selected one by one and transformed over time using operations like scale, rotate, splitAt and moveBy.
adjust/DemoAdjustContour04
Demonstrates an adjustContour animated effect where edge 0 of a contour
is replaced by a point sampled on that edge. The specific edge point oscillates between
0.0 (at the start of the segment) and 1.0 (at the end) using a cosine and the seconds variable.
The base contour used for the effect alternates every second between a rectangular and a circular contour.
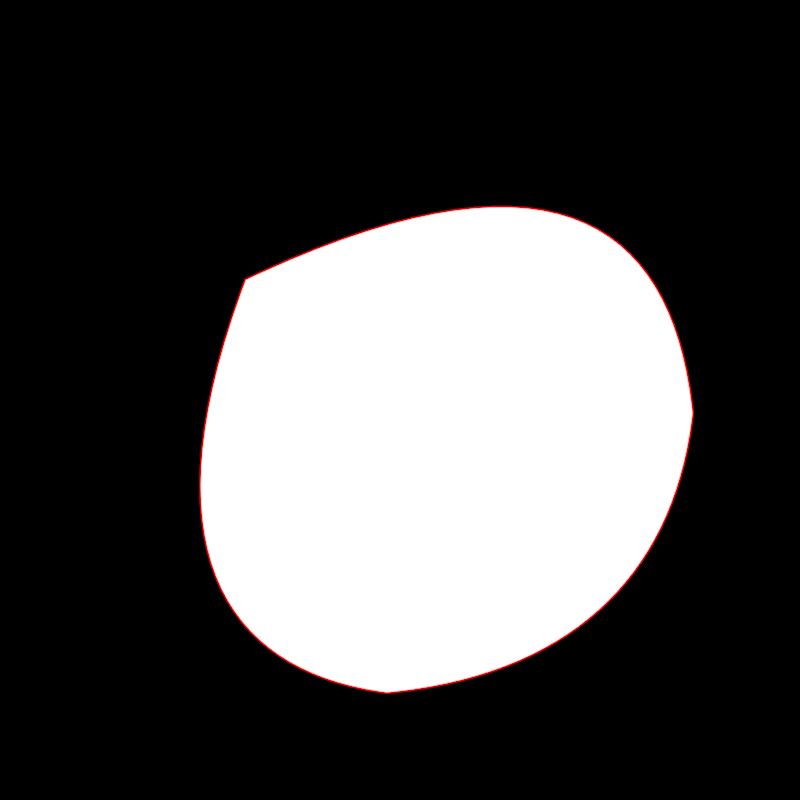
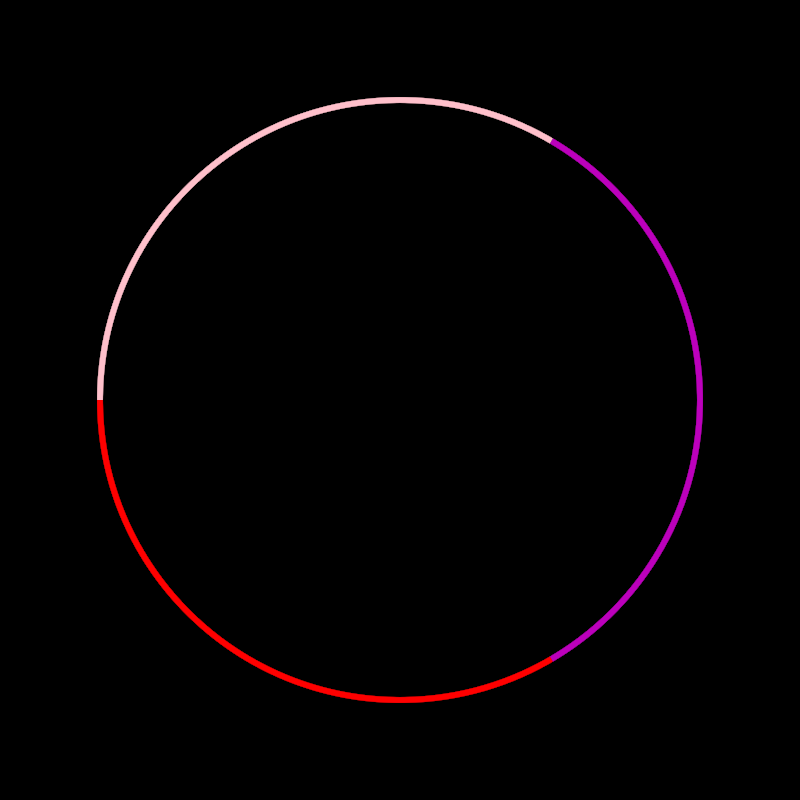
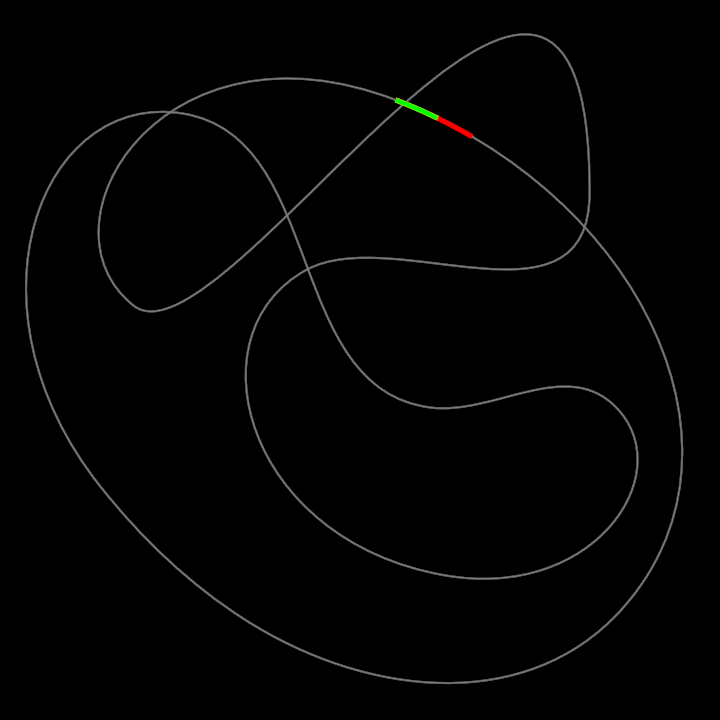
adjust/DemoAdjustContour05
Demonstrates animated modifications to a circular contour using adjustContour.
The application creates a circular contour and dynamically alters its edges based on the current time in seconds. Each edge of the contour is selected and transformed through a series of operations:
- The currently active edge (based on time modulo 4) is replaced with a point at 0.5.
- All other edges are reshaped by reducing their length dynamically, with the reduction calculated using a cosine function involving the current time in seconds.
The resulting contour is then drawn with a red stroke color.
adjust/DemoAdjustContour06
Demonstrates the use of adjustContour
to create an animated effect where edges are split, vertices are selected,
and transformations such as scaling are applied.
The program creates a circular contour which is modified on each animation frame.
- Edges of the circular contour are split dynamically based on a time-based cosine function.
- Newly created vertices are selected and scaled around the center of the contour using time-dependent transformations.
The selection of vertices happens automatically thanks to
parameters.clearSelectedVertices and parameters.selectInsertedVertices
The modified animated contour is finally drawn.
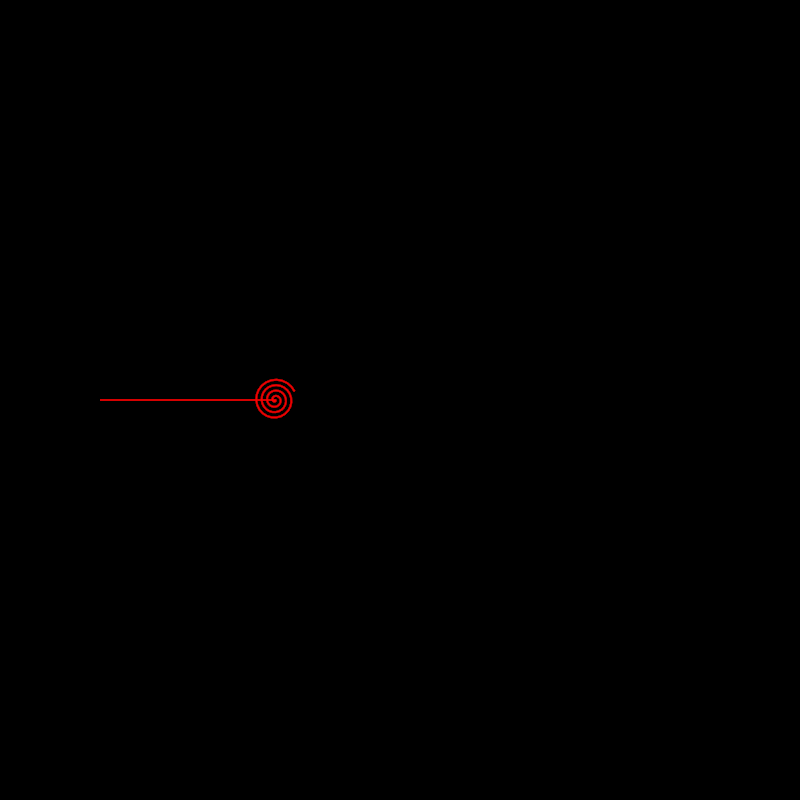
adjust/DemoAdjustContour07
Demonstrates how to create and manipulate a contour dynamically using the adjustContour function.
The program initializes a simple linear contour and applies transformations to it on each animation frame:
- The only edge of the contour is split into many equal parts.
- A value between 0 and 1 is calculated based on the cosine of the current time in seconds.
- That value is used to calculate an anchor point and to select all vertices to its right
- The selected vertices are rotated around an anchor, as if rolling a straight line into a spiral.
adjust/DemoAdjustContour08
Demonstrates how to adjust and manipulate the vertices and edges of a contour.
This method shows two approaches for transforming contours:
- Adjusting vertices directly by selecting specific vertices in a contour and modifying their control points.
- Adjusting edges of a contour by transforming their control points.
For each approach, a red line is drawn representing the transformed contour.
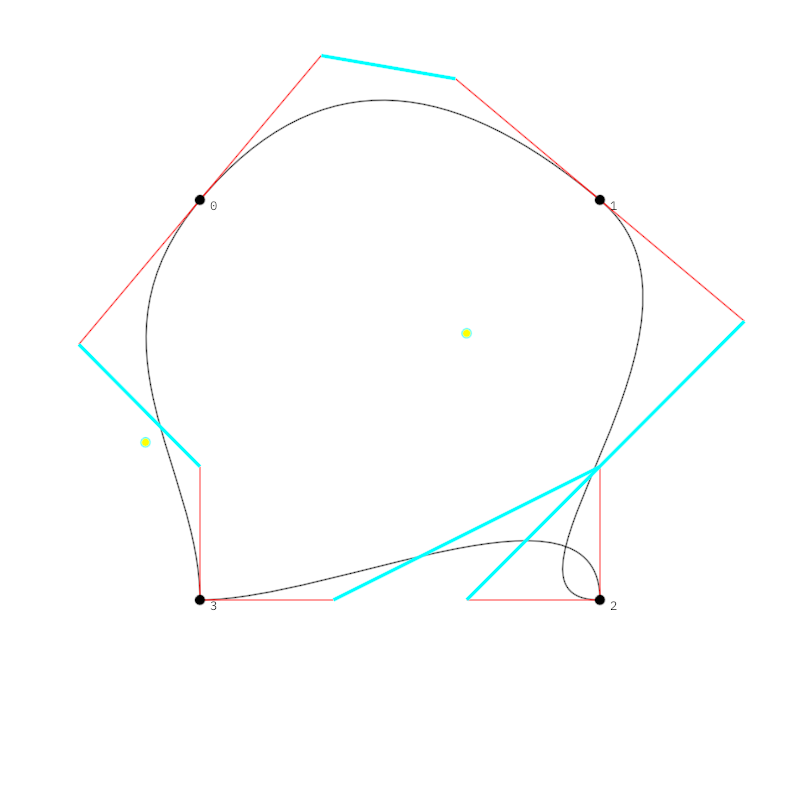
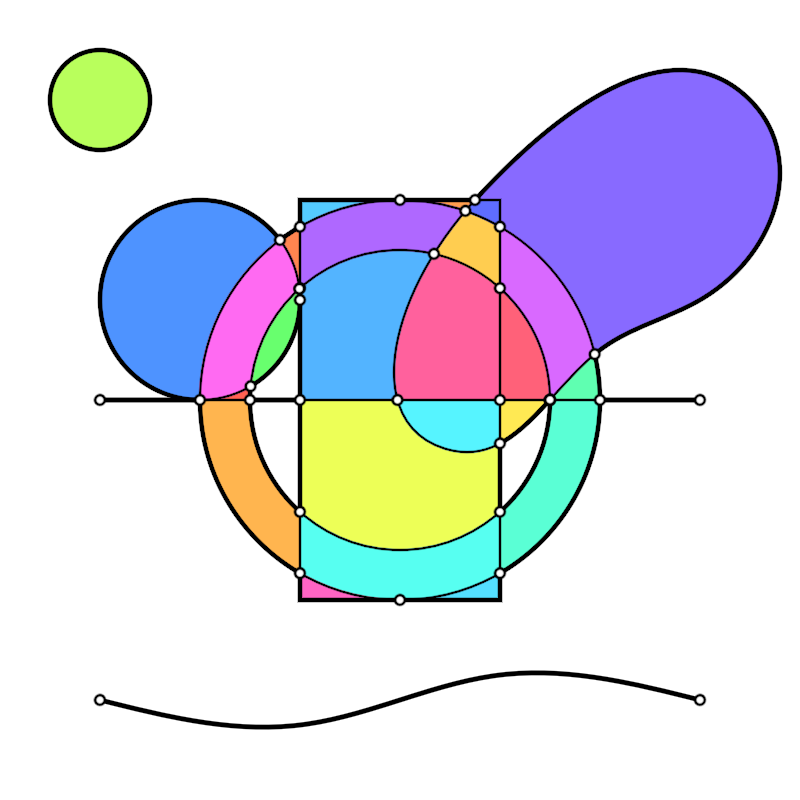
adjust/DemoAdjustContour09
Demonstrates how to manipulate a contour by adjusting and transforming its vertices and edges, and subsequently visualizing the result using different drawing styles.
The program creates a rectangular contour derived by shrinking the bounds of the drawing area. It then applies multiple transformations to selected vertices. These transformations include:
- Averaging tangents for selected vertices
- Scaling and rotating vertex positions based on the horizontal mouse position
- Switching tangents for specific vertices
The resulting contour is drawn in black. Additionally:
- Control line segments are visualized in red, connecting segment endpoints to control points.
- Vertices are numbered and highlighted with black-filled circles.
- Tunni lines, which represent optimized control line placements, are visualized in cyan.
- Tunni points, marking the Tunni line's control, are emphasized with yellow-filled circles.
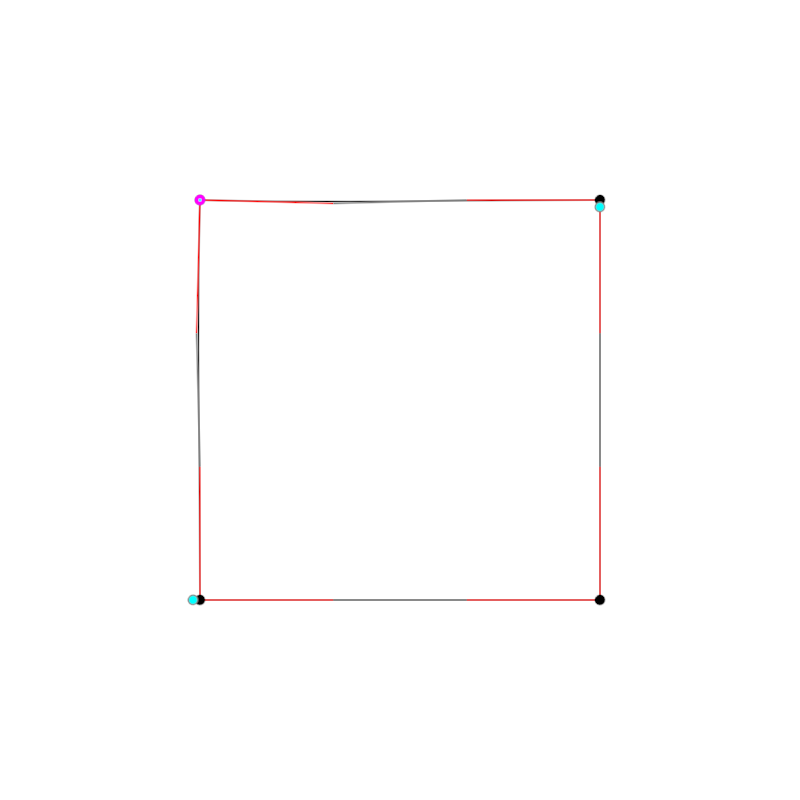
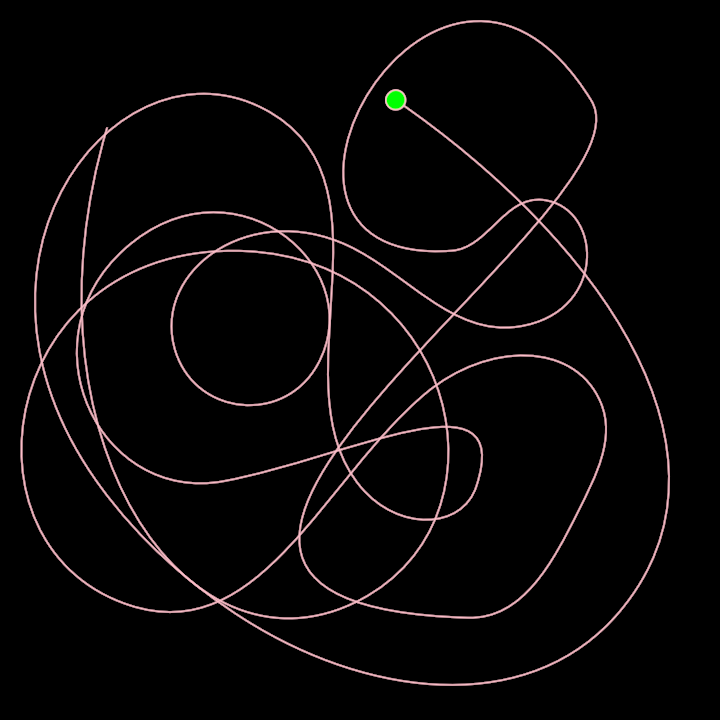
adjust/DemoAdjustContourContinue01
Demonstrates how to adjust and animate contour segments and vertices.
The method initially creates a contour by offsetting the edges of the window's bounds. A process is defined to sequence through various transformations on the contour, such as selecting edges, selecting vertices, rotating points, or modifying segment attributes based on mathematical transformations.
The adjusted contour and its modified segments and vertices are iterated through a sequence and updated in real time. Rendering involves visualizing the contour, its control points, the Tunni lines, Tunni points, as well as the selected segments and points with distinct styles for better visualization.
The complex animation sequence is implemented using coroutines. Two loops in the code alternate
between rotating vertices and adjusting Tunni lines while the extend function takes care of
rendering the composition in its current state.
The core elements to study to in this demo are adjustContourSequence and launch.
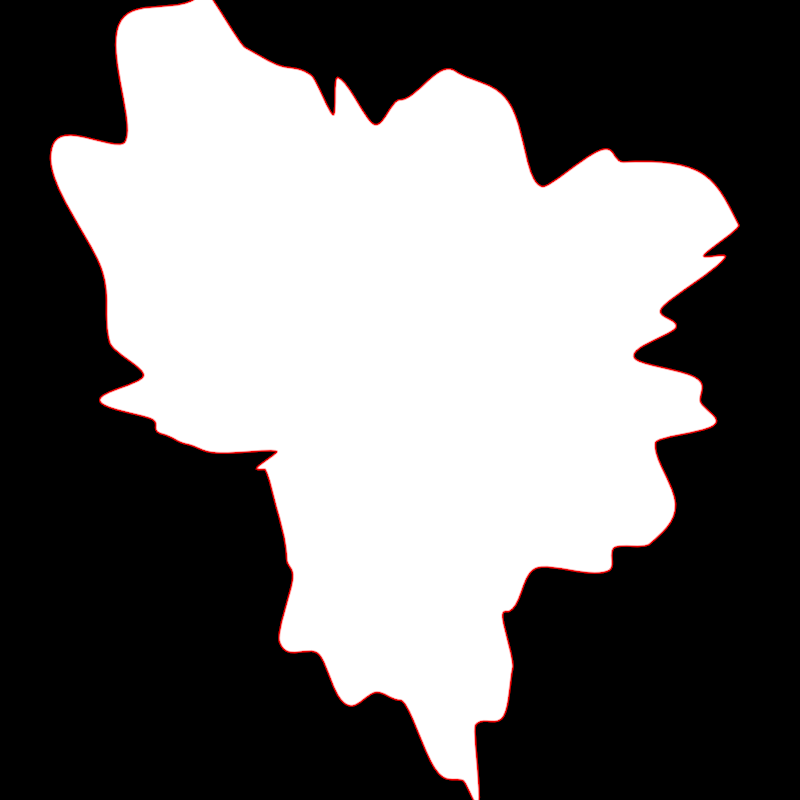
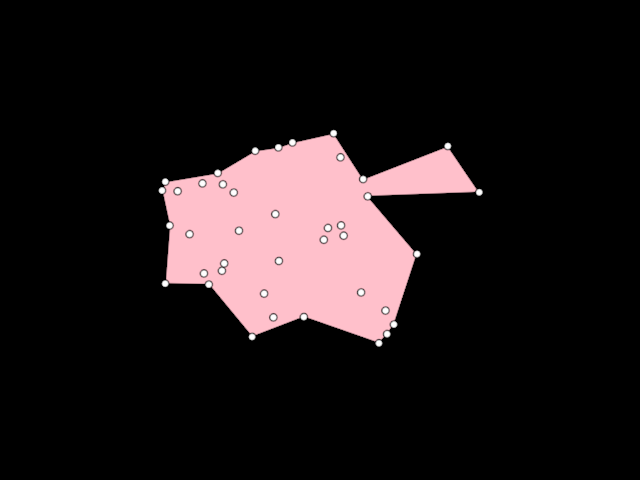
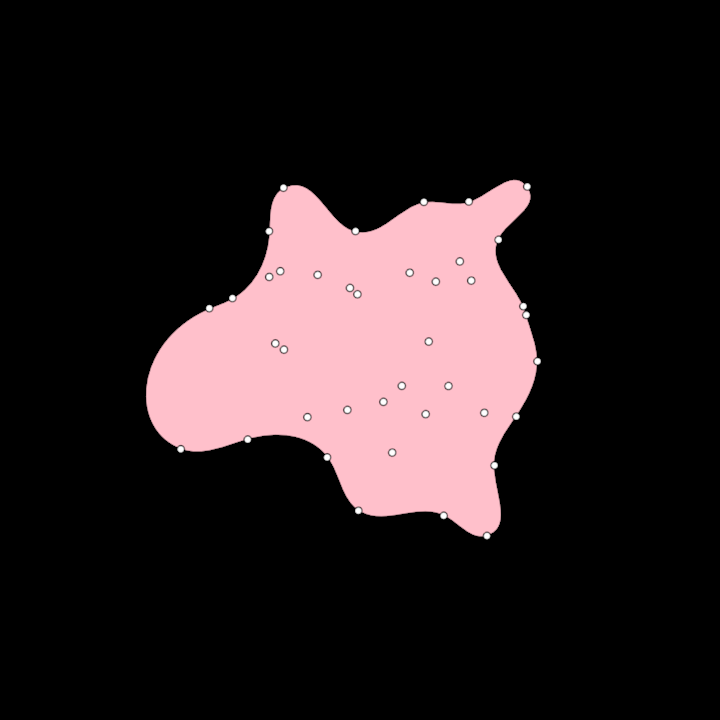
alphashape/DemoAlphaShape01
Demonstrates the use of [AlphaShape] to create a [org.openrndr.shape.ShapeContour] out of a collection of random [Vector2] points. Unlike the convex hull, an Alpha shape can be concave.
More details in WikiPedia
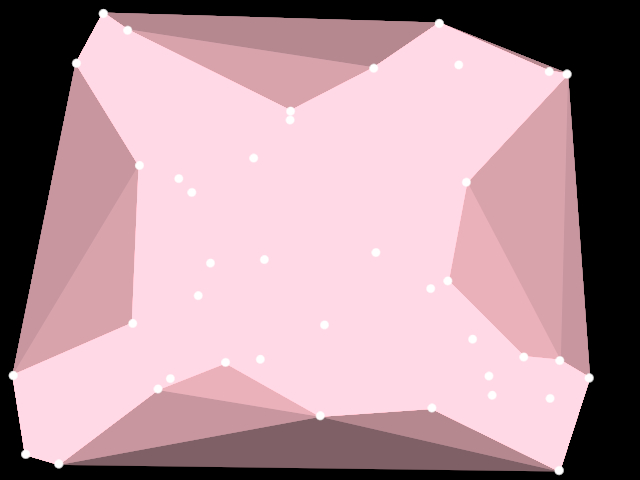
alphashape/DemoAlphaShape02
Demonstrates the use of [AlphaShape] to create ten [org.openrndr.shape.ShapeContour] instances out of a collection of random [Vector2] points.
The same points are used for each contour, but an increased alpha parameter is passed to the AlphaShape algorithm. Higher values return more convex shapes = shapes with a larger surface.
The list of shapes is reversed to draw the smaller contours on top, otherwise only the last one would be visible.
An instance of [Random] with a fixed seed is used to ensure the resulting random shape is always the same.
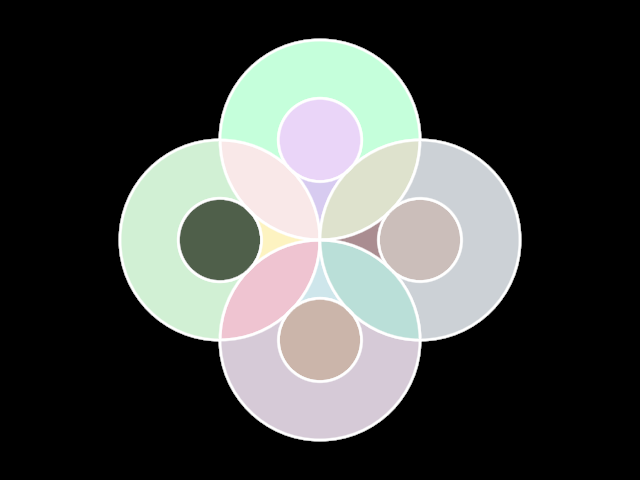
arrangement/DemoArrangement01
Demonstrates the use of Arrangement to create a 2D arrangement of shapes.
The Arrangement constructor takes as arguments instances of [org.openrndr.shape.ShapeProvider]s.
Once constructed, we can request originFaces, edges, vertices, boundaries and holes,
to render or manipulate them further as needed.
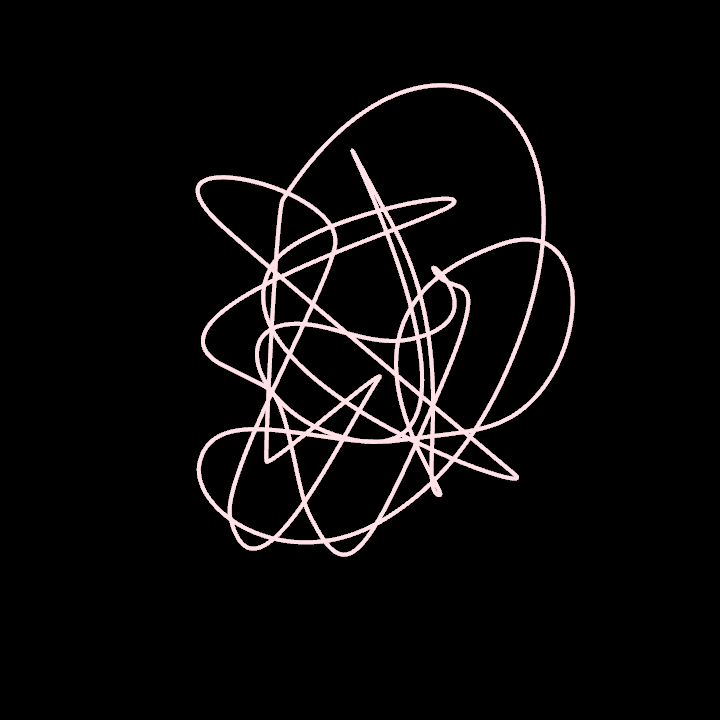
arrangement/DemoArrangement02
Demonstrates the use of Arrangement to create a 2D arrangement of shapes using a self-intersecting curve.
For self-intersections we need to pass the same curve twice as arguments to Arrangement. The specific curve used results in 4 intersection points.
This demo shows how we can query and visualize the neighborhoods of those 4 vertices.
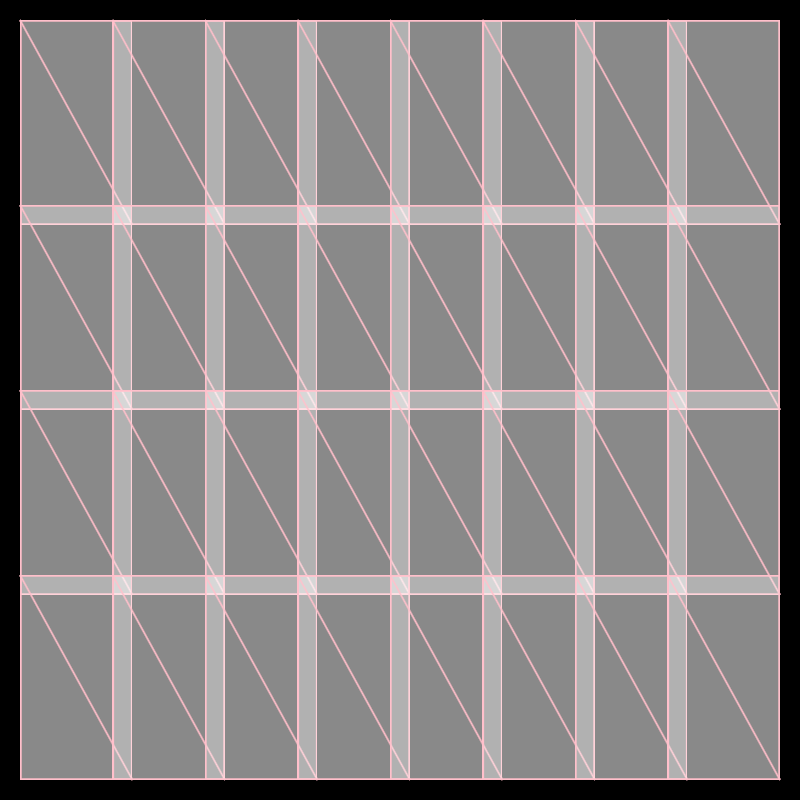
arrangement/DemoArrangement04
Demonstrates using the boundedFaces collection available in Arrangements.
boundedFaces elements have a contour property, while unboundedFaces do not.
In this example, faces contains 25 items: 24 bounded and 1 unbounded faces.
bezierpatch/DemoBezierPatch01
Shows how to
- create a [bezierPatch] out of 4 [LineSegment]
- create a sub-patch out of a [bezierPatch]
- create horizontal and vertical [ShapeContour]s out of [bezierPatch]es
The created contours are horizontal and vertical in "bezier-patch space" but are rendered deformed following the shape of the bezier patch.
bezierpatch/DemoBezierPatch02
Shows how to create a [bezierPatch] out of a closed [ShapeContour] with 4 curved segments.
Calling [Circle.contour] is one way of producing such a contour with vertices at the cardinal points but one can manually create any other 4-segment closed contour to use in bezier patches.
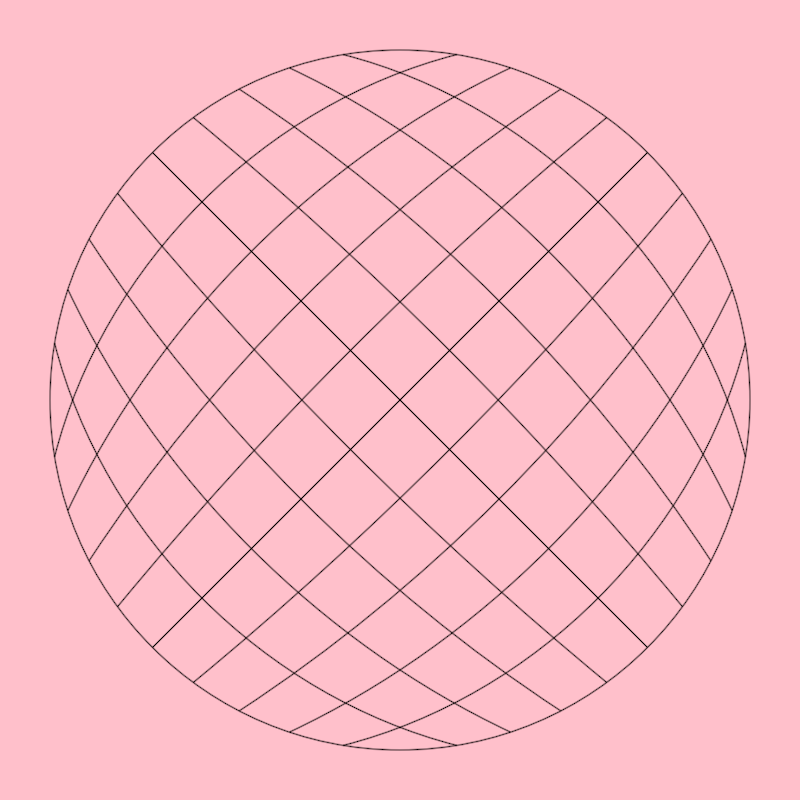
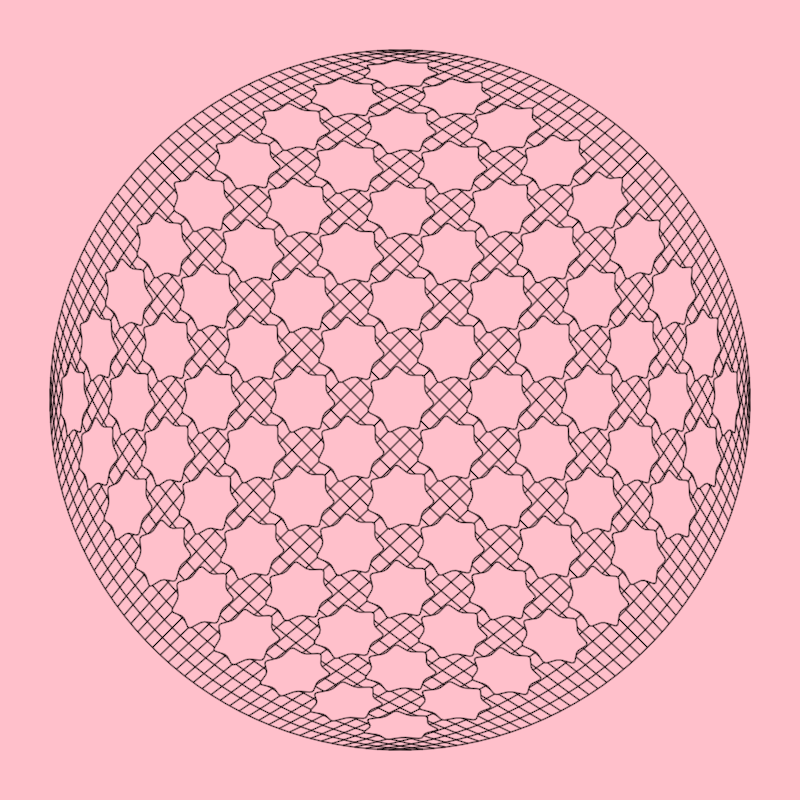
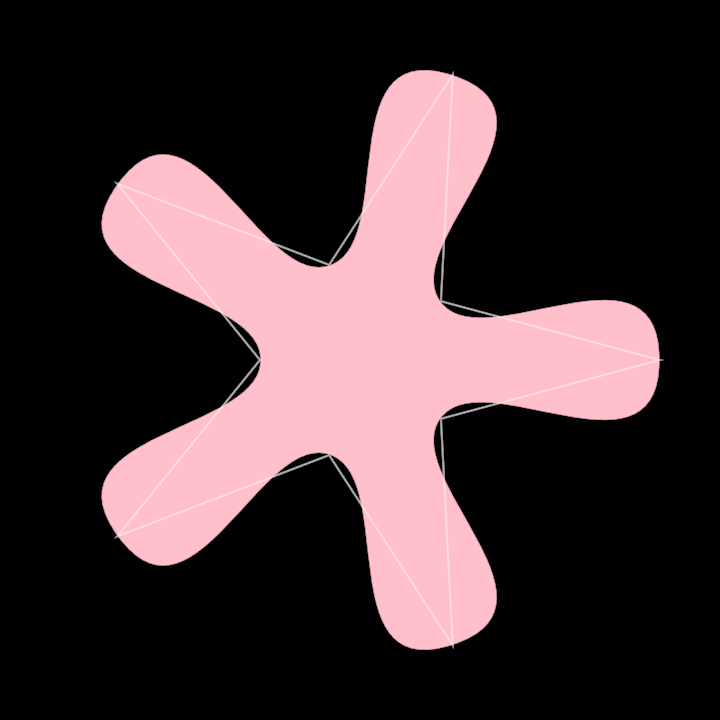
bezierpatch/DemoBezierPatch03
Shows how to distort [ShapeContour]s using a [bezierPatch]
In this case the contours are regular stars and the bezier patch is created using a circular contour with the required 4 segments.
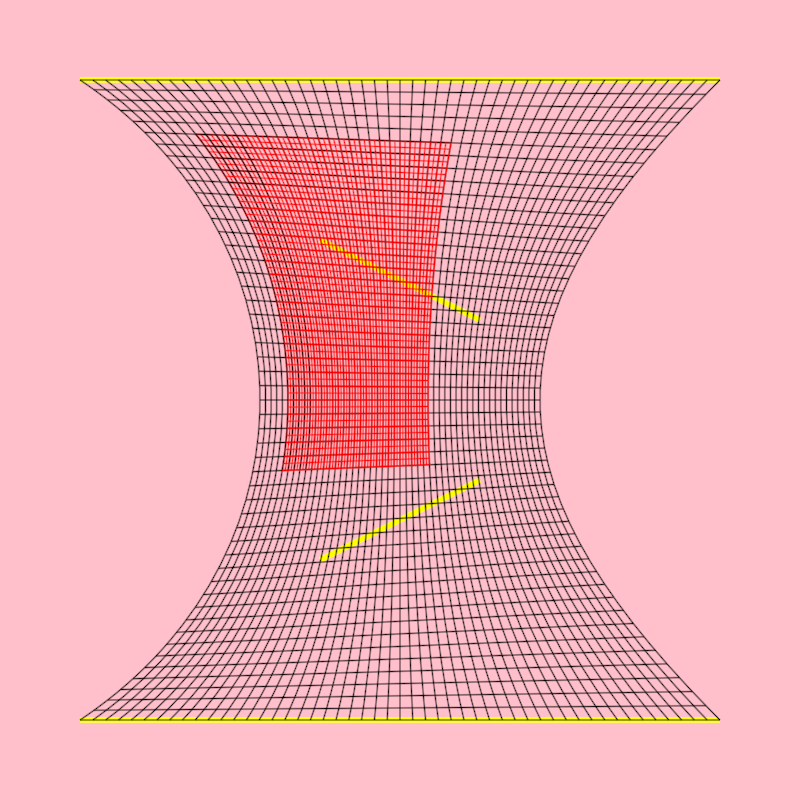
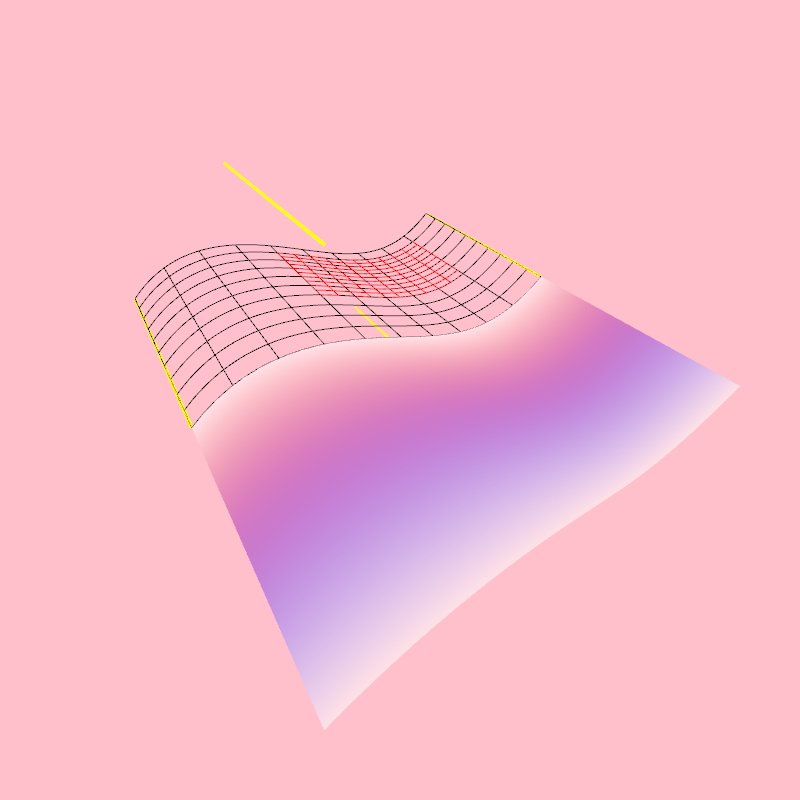
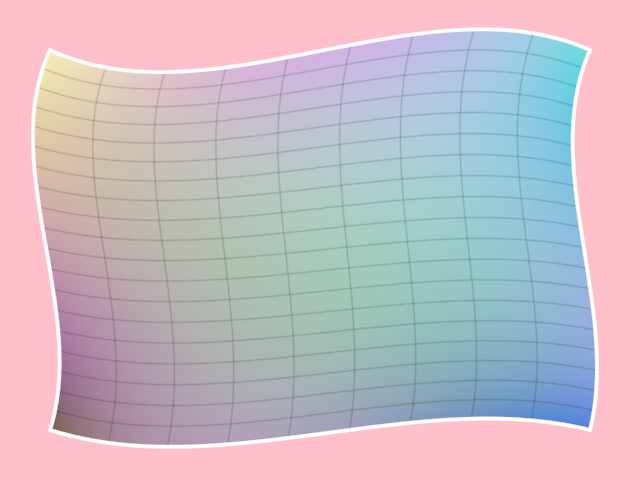
bezierpatch/DemoBezierPatch04
Shows how to get positions and gradient values of those positions from a [bezierPatch]
You can think of bezierPatch.position() as requesting points in a wavy flag (the bezier patch) using normalized uv coordinates.

bezierpatch/DemoBezierPatch05
Shows how to
- create a [bezierPatch] out of 4 [Segment3D]
- create a sub-patch out of a [bezierPatch]
- create horizontal and vertical [Path3D]s out of [bezierPatch]es
- add colors to a [bezierPatch]
- draw a [bezierPatch] surface
The created contours are horizontal and vertical in "bezier-patch space" but are rendered deformed following the shape of the bezier patch.
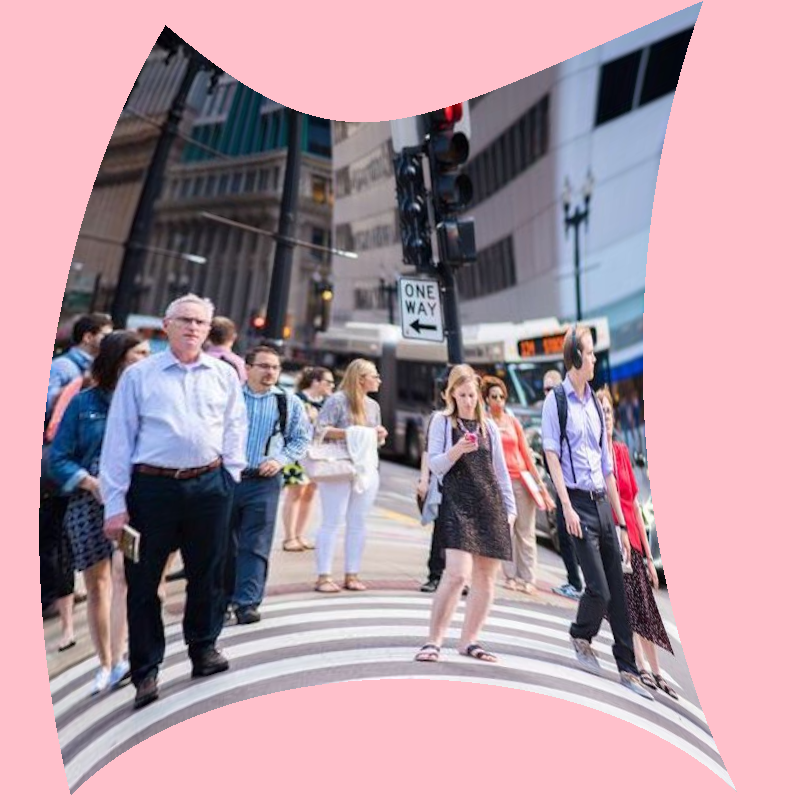
bezierpatch/DemoBezierPatch06
Shows how to
- create a [bezierPatch] out of 4 curved Segment2D instances
- apply an image texture to the patch using a shadeStyle
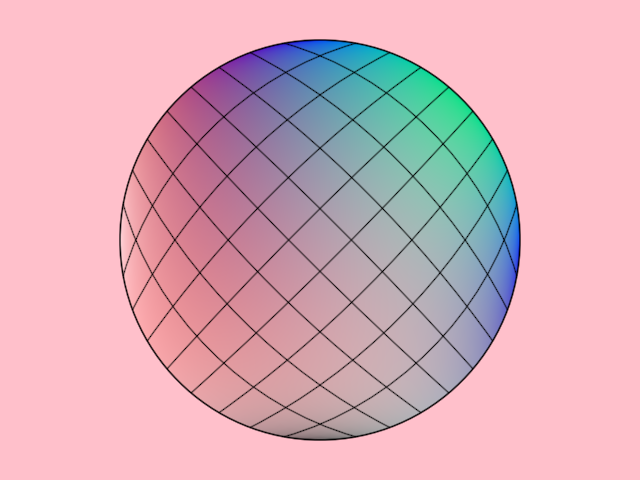
bezierpatch/DemoBezierPatchDrawer01
Demonstrates how to draw a bezier patch and its corresponding contours. The bezier patch is generated from a circular shape and is assigned colors for each control point. The patch is subdivided into horizontal and vertical contours, which are rendered to visualize the structure of the bezier patch.
The bezier patch constructor expects a contour with 4 segments, for example a rectangular contour or a circle, which in OPENRNDR is made out of 4 segments.
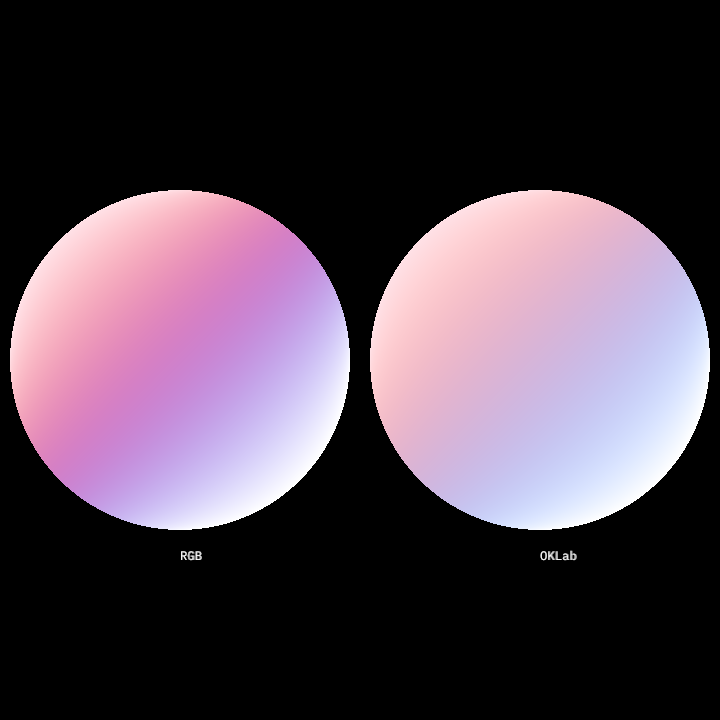
bezierpatch/DemoBezierPatchDrawer02
Demonstrates how to use bezier patches with specified colors and displays text labels for the color space used in each. This method:
- Creates two bezier patches with different color spaces (RGB and OKLab).
- Draws these bezier patches using the drawer.
- Renders text labels to differentiate the color spaces used.
The bezier patches are created from closed circular contours and colored by specifying a grid of colors matching the patch's vertices.
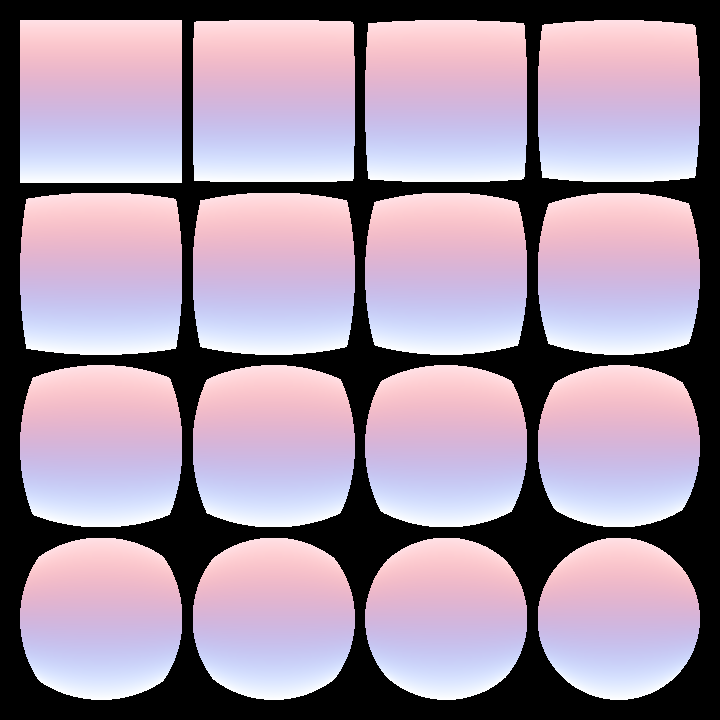
bezierpatch/DemoBezierPatchDrawer03
Demonstrates how to render a grid of bezier patches that morph between a rectangle and a rotated circle contour. These shapes are transformed into bezier patches, and their colors are interpolated through a blend factor calculated for each cell in the grid.
The grid layout contains 4 columns and 4 rows with margins and gutters. Each cell's center serves as the drawing position for a blended bezier patch.
bezierpatch/DemoBezierPatchDrawer04
Demonstrates how to create and render a bezier patch with randomized control points
and colors. The bezier patch is derived from a scaled-down copy of the
drawer bounds, converted to a contour and deformed using adjustContour.
The bezier patch uses 16 randomly generated colors chunked into 4 lists with 4 colors each.
bezierpatch/DemoBezierPatches01
Shows how to create a [bezierPatch] out of a closed [ShapeContour] with 4 curved segments.
Calling [Circle.contour] is one way of producing such a contour with vertices at the cardinal points but one can manually create any other 4-segment closed contour to use in bezier patches.

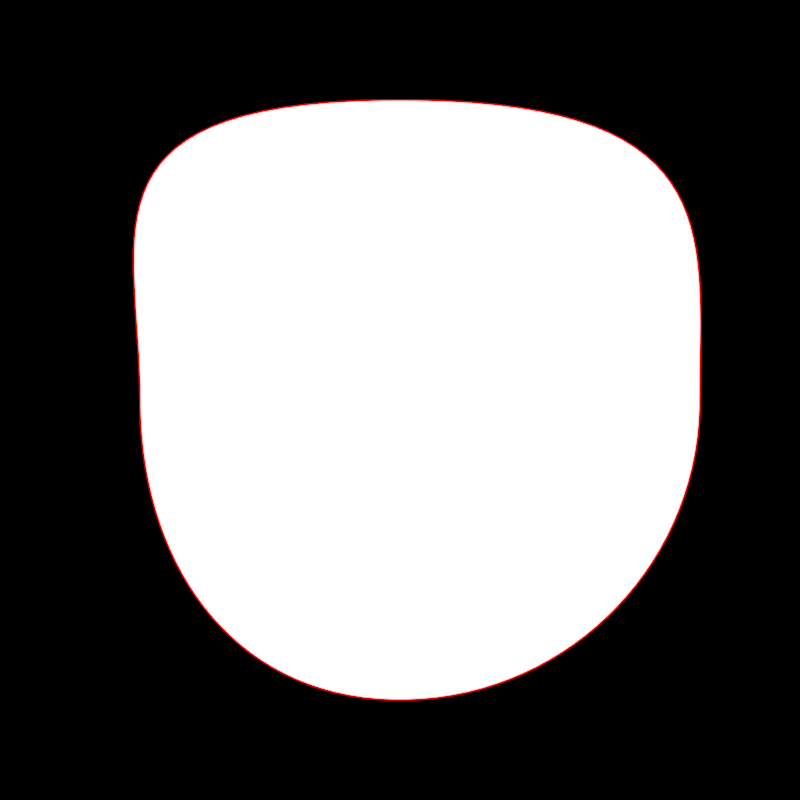
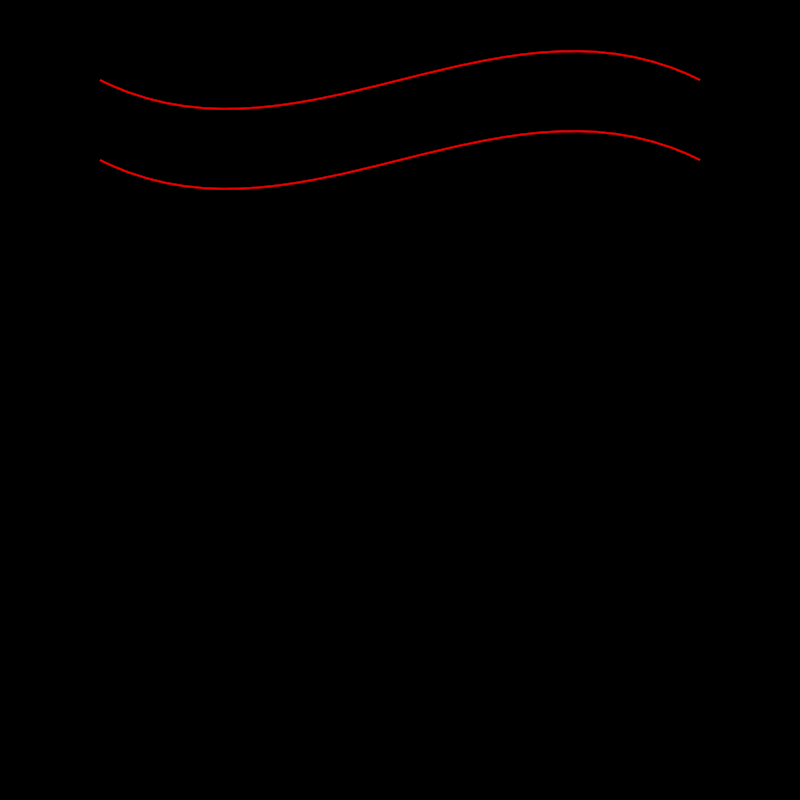
blend/DemoContourBlend01
Animated demonstration of uniform contour blending. Once a ContourBlend between two
contours is created, it can be queried using the .mix() method to get a contour interpolated
between the first one (when the blend argument is 0.0) and the second one (when the argument
is 1.0)
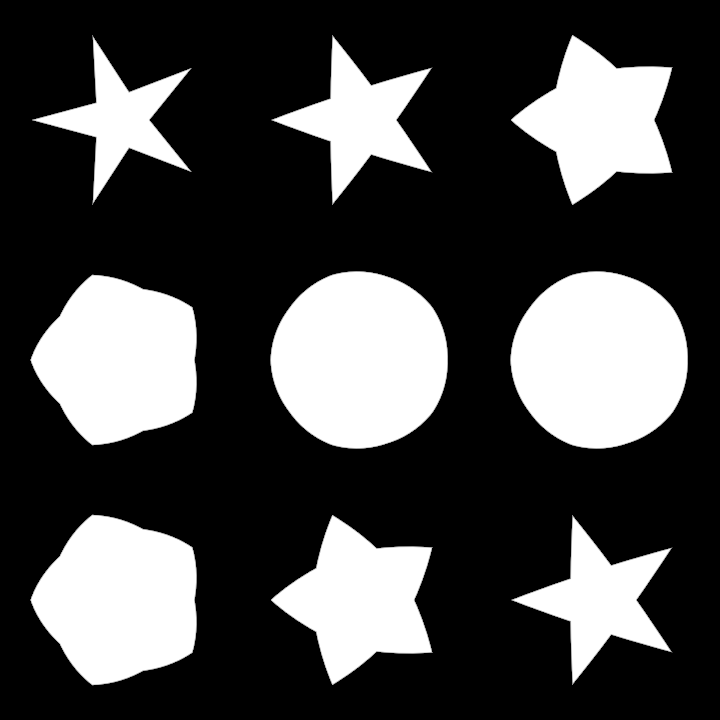
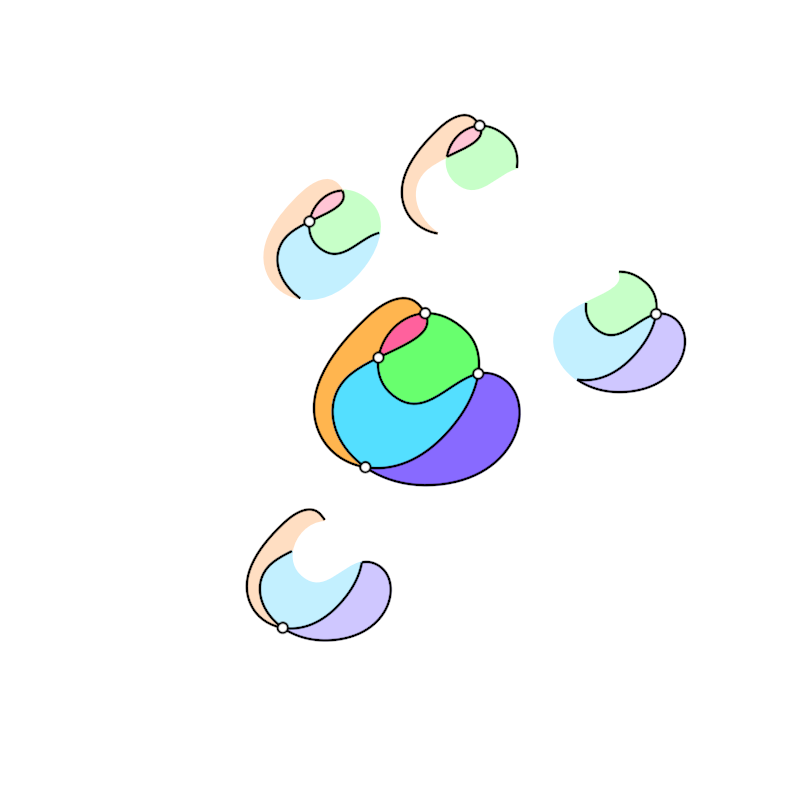
blend/DemoContourBlend02
Demonstration of non-uniform contour blending
The mix method of a ContourBlend does not only accept a Double, but also a function.
This function should take one Double argument, which specifies the normalized t value between
the start and the end of the contour, and should return a normalized value indicating the
morphing state between the first contour and the second contour, for that specific t value.
This allows us, for instance, to morph one part of the shape first, then have other parts follow.
This demo shows a grid of 9 contours which are part circle and part 5-point start.
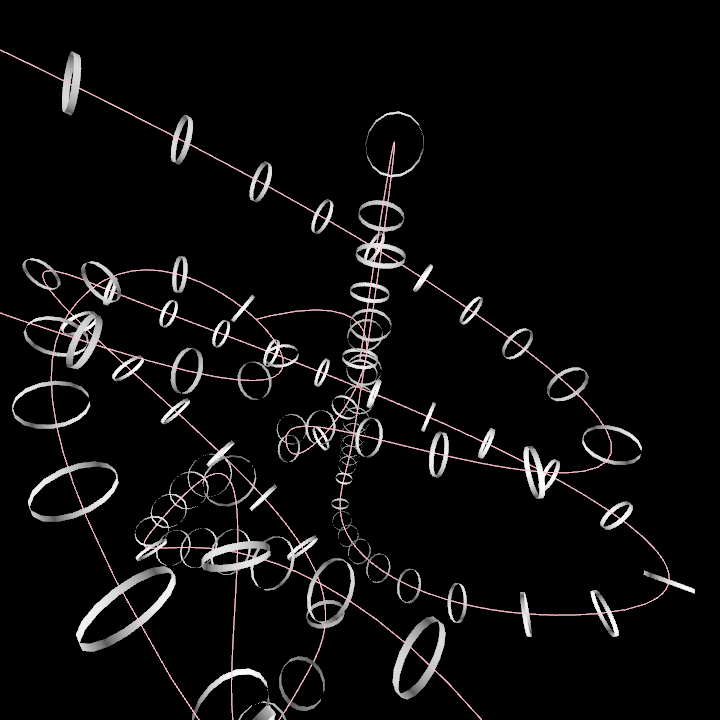
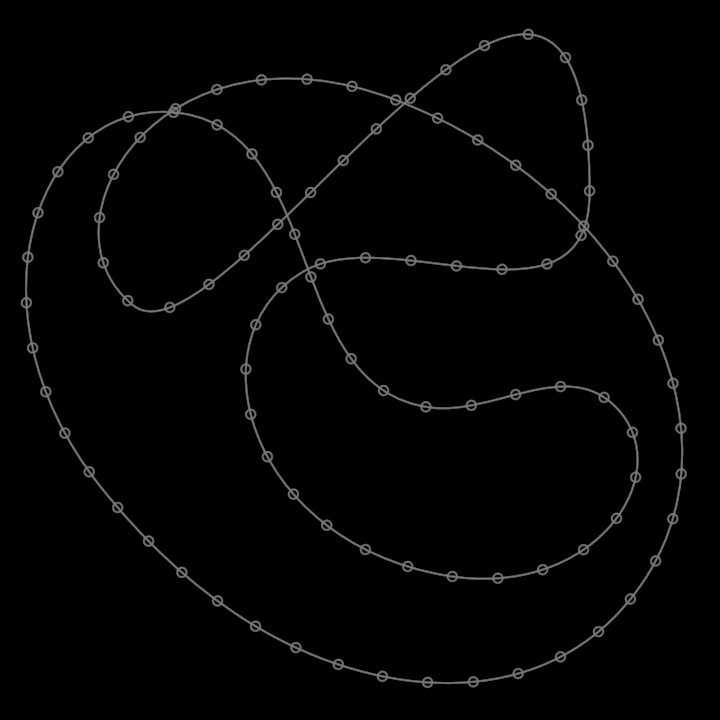
frames/DemoFrames01
Demonstrates how to create a 3D path and attach cylinders to it at regular intervals with the correct orientation.
- The path is constructed using the
path3Dbuilder. - A rectified copy is created to be able to sample it at equal-length intervals.
- We call the
framesmethod on the rectified contour to generate a list with 100 transformation matrices which make it possible to attach oriented 3D objects at specific locations in the curve. - We finally use the transformation matrices to draw cylinders along the 3D path.
The orbital camera extension enables interactive 3D view manipulation.
A fixed random seed is used to make sure this demo outputs a specific output. We can delete the
random arguments to get a unique result each time the program runs.
hobbycurve/DemoHobbyCurve01
Demonstrates how to use the hobbyCurve function to render a smooth closed contour passing through a predefined set of points.
See Hobby, John. D., “Smooth, Easy to Compute Interpolating Splines”, Discrete and Computational Geometry, 1986, vol. 1
hobbycurve/DemoHobbyCurve02
This demo creates a list of random 2D points, finds the alpha shape contour for those points,
and finally makes that contour smooth by calling hobbyCurve().
hobbycurve/DemoHobbyCurve03
This demo shows how the [org.openrndr.shape.ShapeContour]'s method hobbyCurve() can be used
to round contours with linear segments.
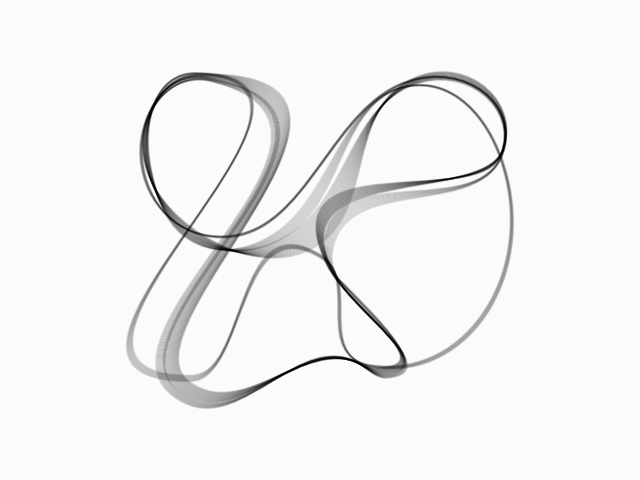
hobbycurve/DemoHobbyCurve04
Demonstrates the use of the tensions argument when creating a Hobby curve.
The program starts by creating a random set of scattered points with enough separation between them.
The points are sorted using hilbertOrder to minimize the travel distance when visiting all the points.
Finally, we draw a set of 40 hobby translucent curves using those same points but with varying tensions.
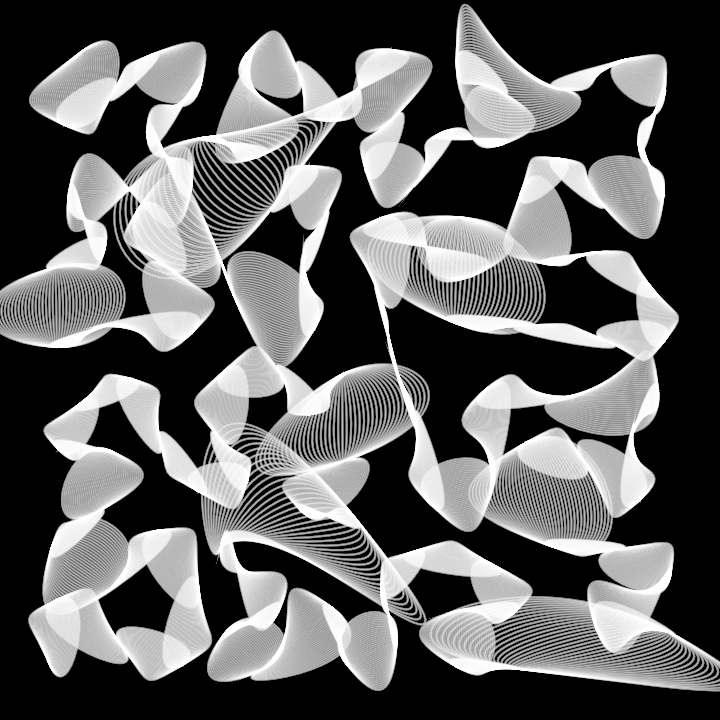
hobbycurve/DemoHobbyCurve05
Demonstrates the creation of a 40 hobby curves with 10 points each. The control points in all hobby curves are almost identical, varying only due to a slight increase in one of the arguments of a simplex noise call.
The program shows that minor displacements in control points can have a large impact in the resulting curve.
hobbycurve/DemoHobbyCurve3D01
Demonstrates how to use the 3D implementation of the hobbyCurve method, to draw a smooth curve passing
through various 3D points in space.
The program first creates a random set of 2D points at least 200 pixels away from the window borders.
Then, on every animation frame, it recreates a 3D hobby curve by giving depth to each 2D point. The same seed is used for randomness, so the same depths are assigned on every animation frame, although varying tensions are applied to each segment, based on cosines of the current time in seconds.
Commenting out the camera rotation (camera.rotate) reveals how the segment tensions change over time.
The last few lines of the program enable a rotating 3D camera and draw the 3D path.
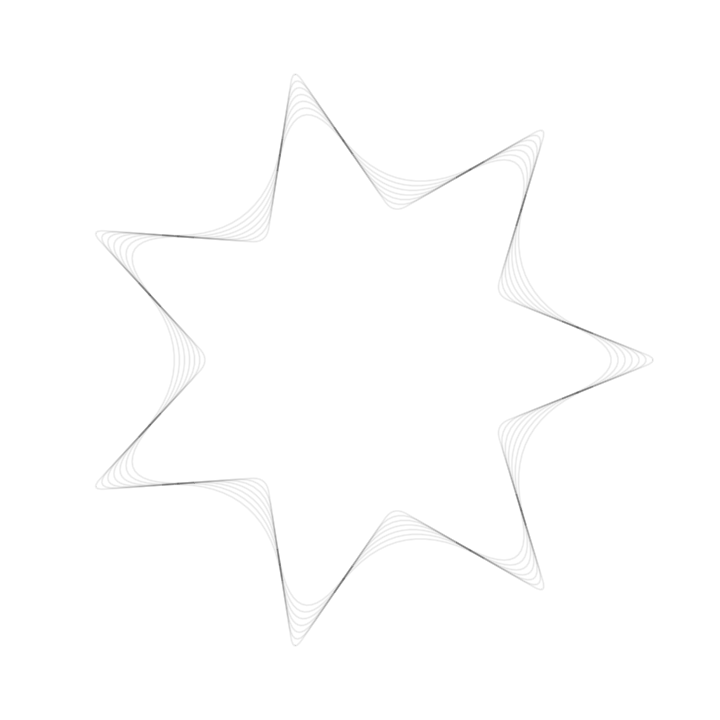
operators/DemoRoundCorners01
Demonstrates how to use the roundCorners method to round the sharp corners
of a [org.openrndr.shape.ShapeContour] made out of linear segments.
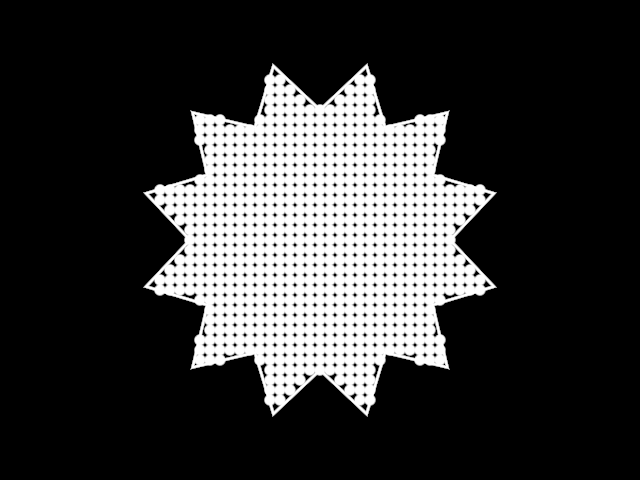
The program creates a regular start with 7 points, then draws 7 variations of this star with various levels of rounding.
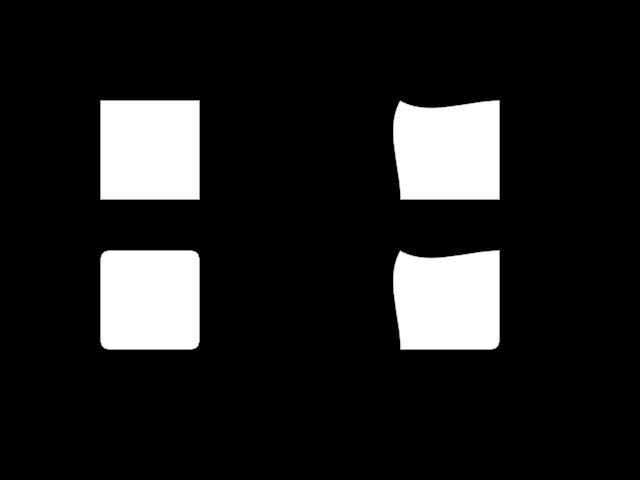
operators/DemoRoundCorners02
Demonstrates how, with the current implementation of roundCorners, only pairs of consecutive linear segments
are rounded. If one of the segments in the pair is a quadratic or cubic Bezier, no rounding is applied.
The program creates a list with two rectangular contours. In the second of them a vertex is rotated, causing two segments to become curved.
Next, rounded versions of both contours are stored in a new list.
Finally, all 4 shapes are displayed for comparison.
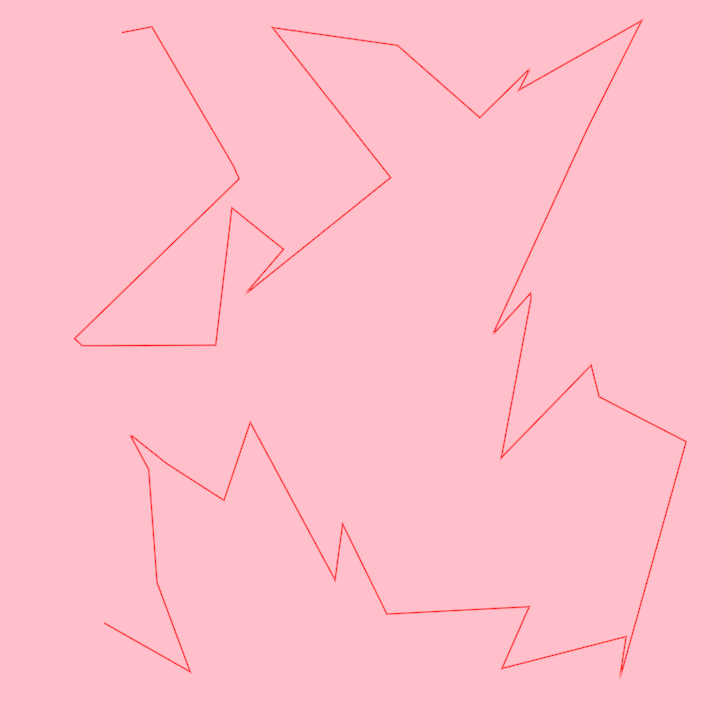
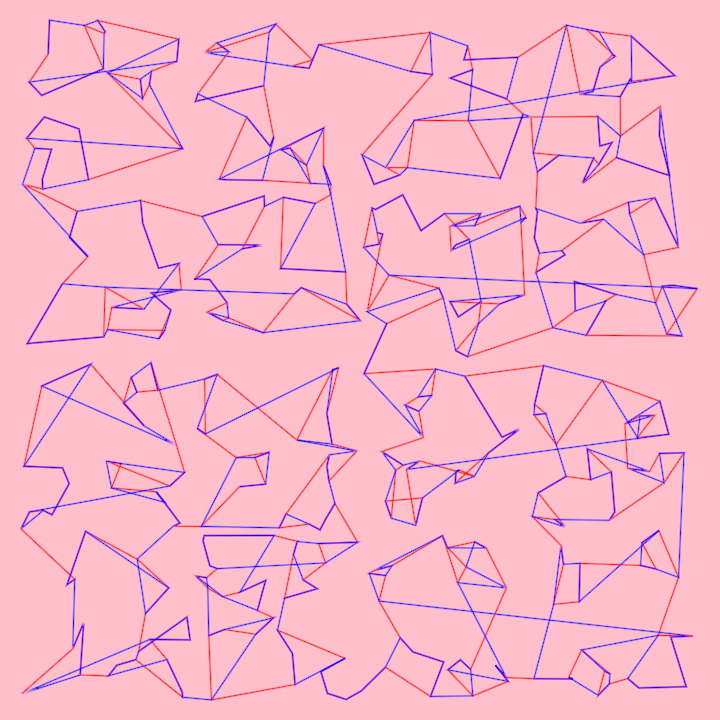
ordering/DemoHilbertOrder01
Demonstrates the use of the hilbertOrder method to sort 2D points in a list of random points.
When drawing the sorted points as a line strip, this line crosses itself fewer times than if the points were drawn in a random order (sometimes zero crossings, depending on the number and layout of the points).
The Hilbert curve (also known as the Hilbert space-filling curve) is a continuous fractal space-filling curve first described by the German mathematician David Hilbert in 1891 https://en.wikipedia.org/wiki/Hilbert_curve
ordering/DemoHilbertOrder02
Shows the difference between sorting the same random points in 2D (in red) and in 3D (in blue).
To be able to sort the points in 3D, the 2D points are temporarily converted to 3D with 0.0 as the z component,
sorted, then converted back to 2D discarding the z component.
Try out the alternative mortonOrder as well.
Note that the bits argument can be either 5 or 16 in 2D, and 5 or 10 in 3D, other values are not supported.
path3d/DemoPath3DProjection
Demonstrates how to convert a 3D path as seen by an [Orbital] camera to a 2D [ShapeContour].
Among other uses, this can be useful when working with pen plotters, to export a 3D path to an SVG file, or to apply 2D contour post-processing with [org.openrndr.extra.shapes.adjust.adjustContour].
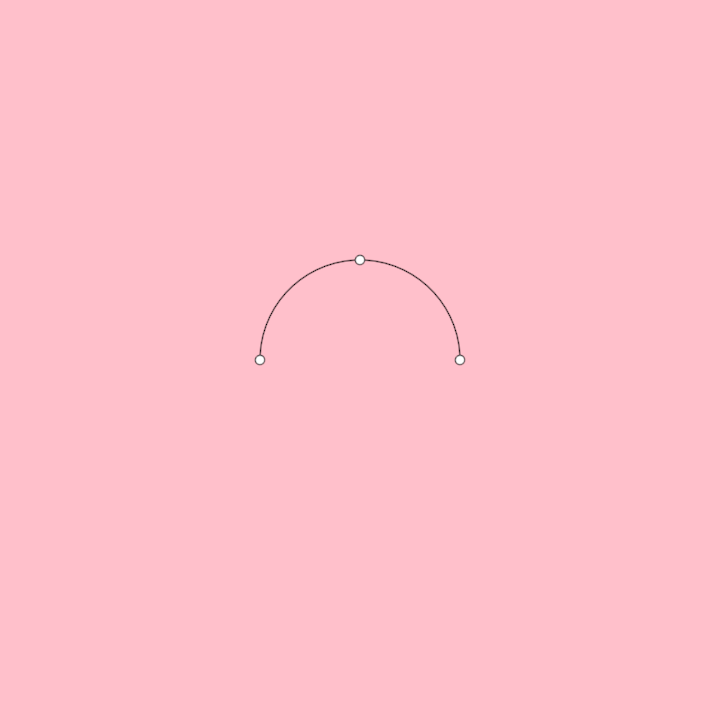
primitives/DemoArc01
Shows how to create an Arc centered on the window. The start and end angles of the arc increase 36 degrees
per second, resulting in an animated effect.
The contour property of the arc is used for rendering.
The start, mid and end points of the arc are queried using it's position() method
to draw small circles at those locations.
primitives/DemoCircleInversion01
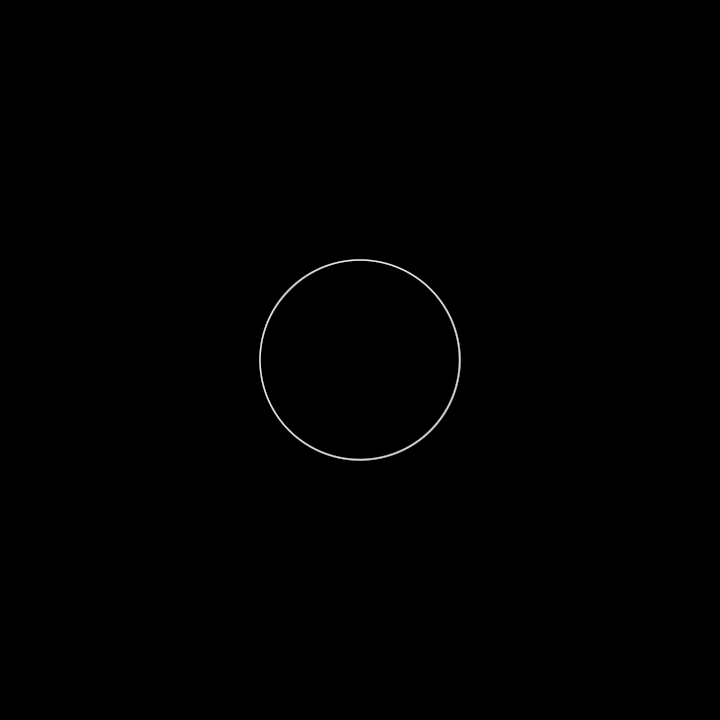
primitives/DemoCircleInversion02
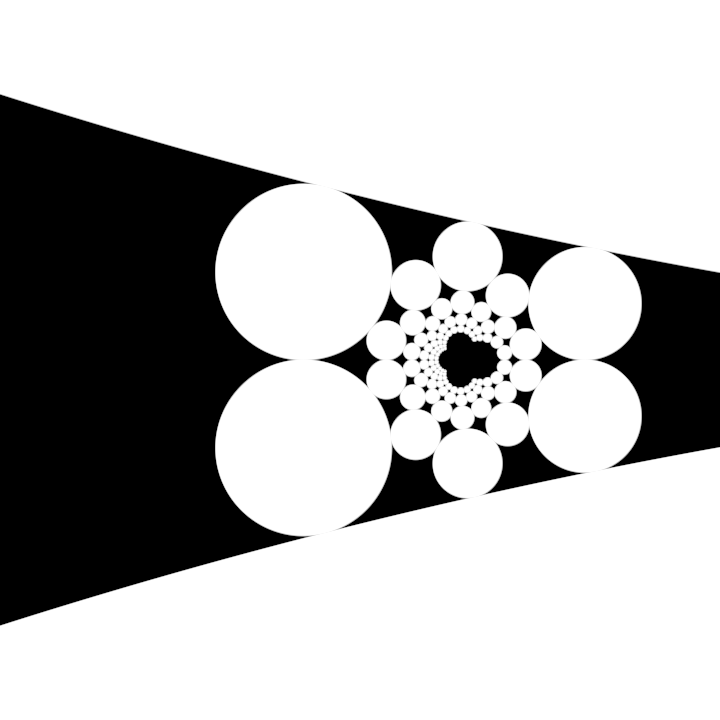
primitives/DemoCircleInversion03
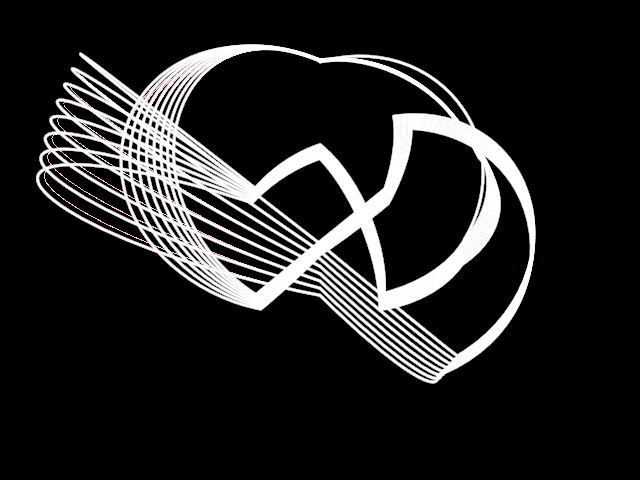
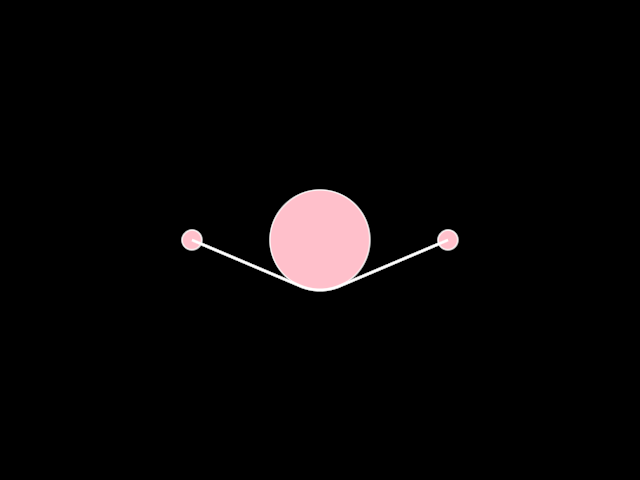
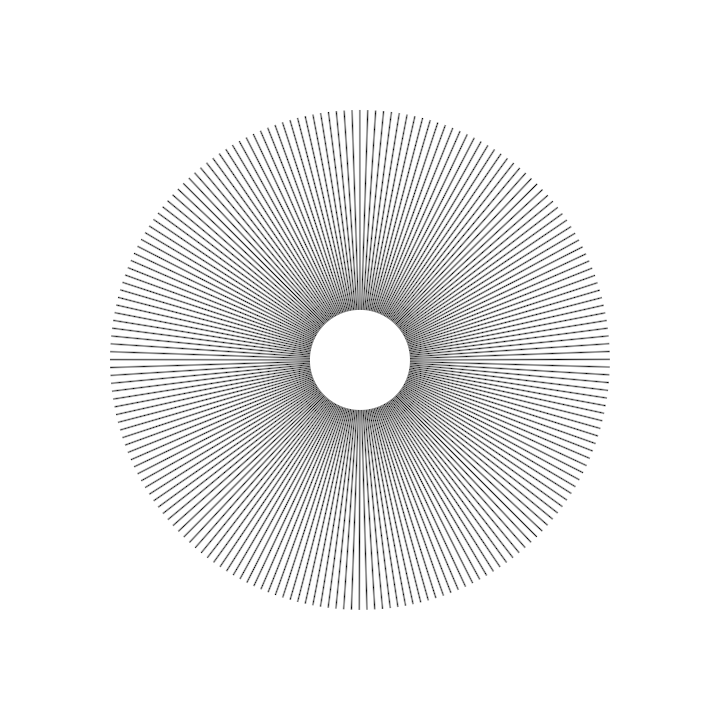
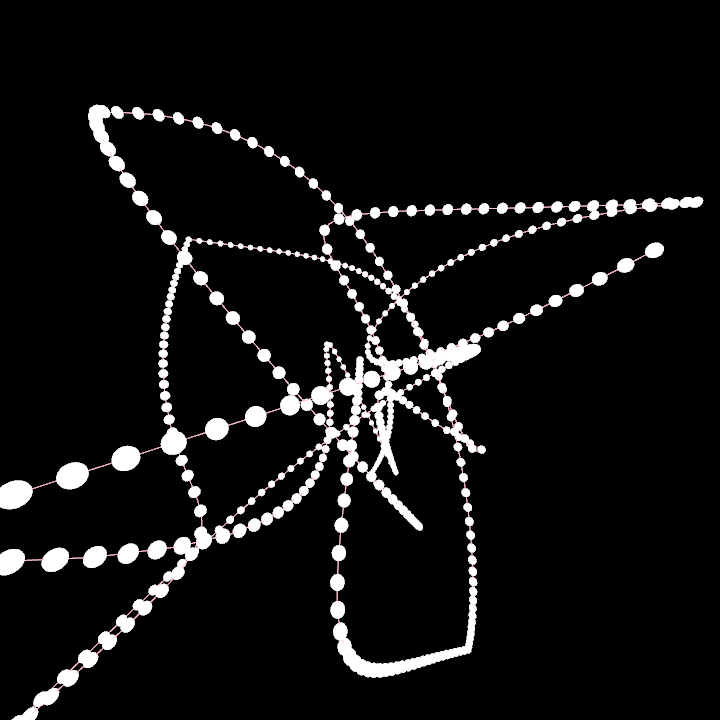
primitives/DemoNet01
Shows how to create and render a [Net]: a structure that connects two points with a circle in between, forming a string-like shape.
The main circle moves following an invisible infinite sign, formed by a pair of sine functions. The moving circle is connected to two smaller static circles via a [Net], rendered as a white contour with a stroke weight 2 pixels wide.
primitives/DemoPulley01
Demonstrates how to create and render a [Pulley]: a system defined by two circles connected by their outer tangents.
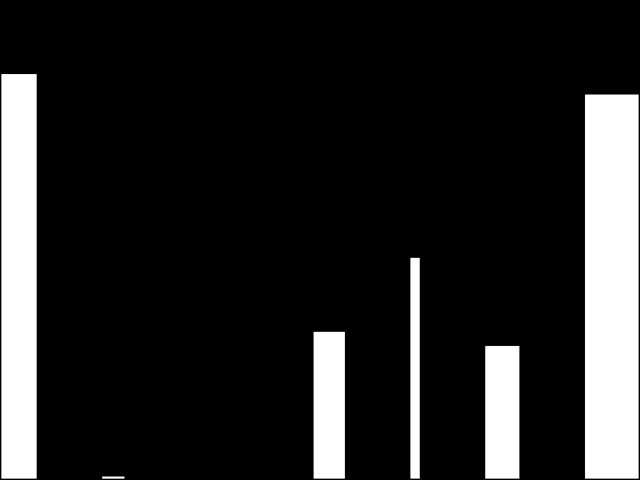
primitives/DemoRectangleDistribute01
of rectangles, which are generated and manipulated based on time and random parameters. The application follows these steps:
- Initializes a random generator seeded with the elapsed seconds since the start of the program.
- Creates a sequence of rectangles using the
uniformSubfunction to generate random sub-rectangles within the bounding rectangle of the canvas. - Distributes the generated rectangles horizontally within the canvas using the
distributeHorizontallymethod. - Aligns the rectangles vertically according to their position in relation to the bounding rectangle and a dynamic anchor point derived from the cosine of elapsed time.
- Renders the rectangles on the canvas in the output window.
primitives/DemoRectangleFitHorizontally
primitives/DemoRectangleGrid01
primitives/DemoRectangleGrid02
primitives/DemoRectangleGrid03
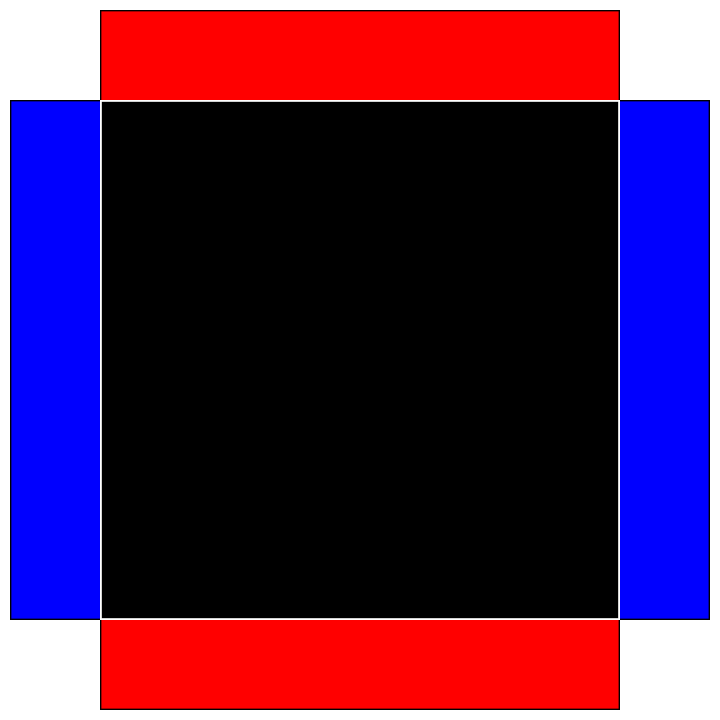
primitives/DemoRectangleIntersection01
Demonstrate rectangle-rectangle intersection
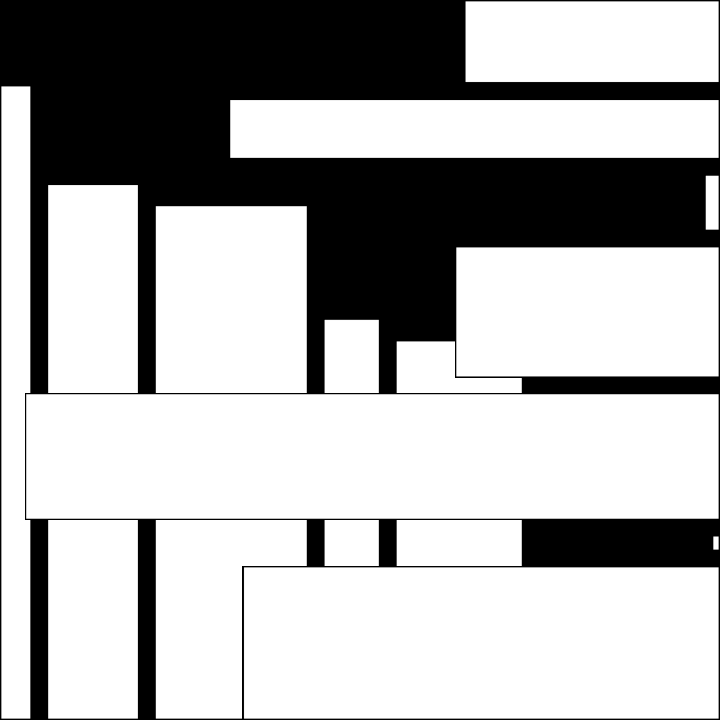
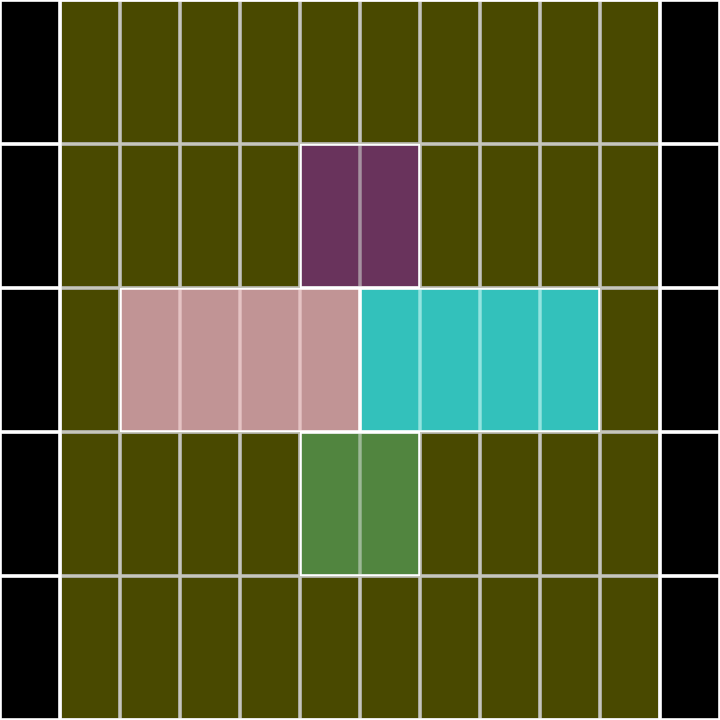
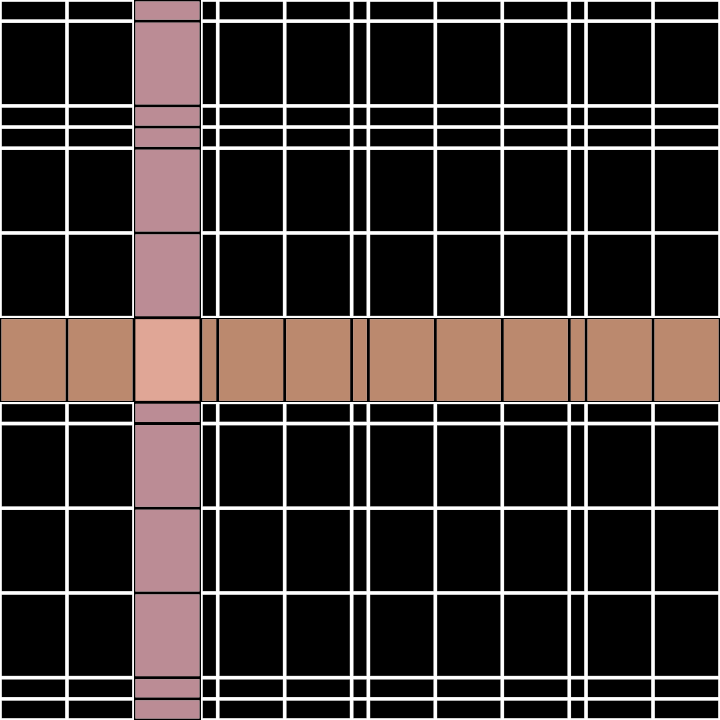
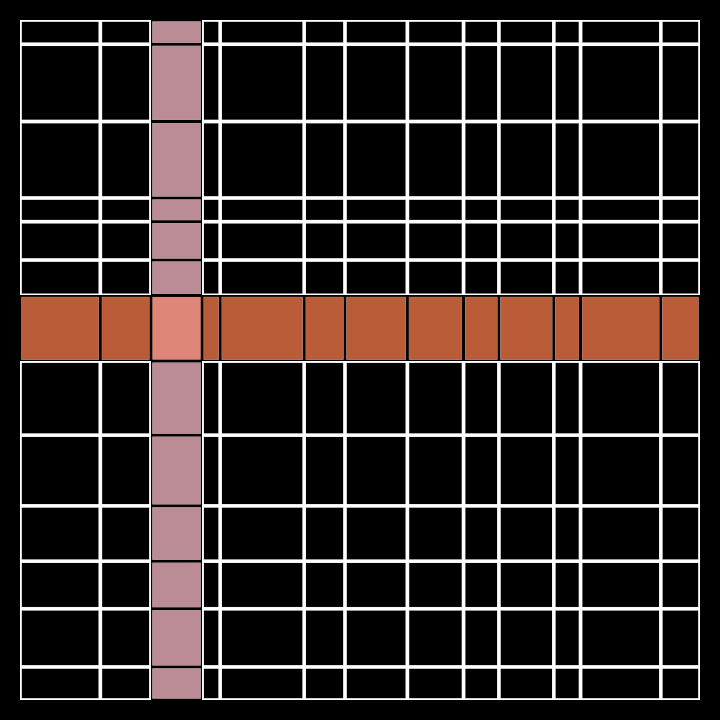
primitives/DemoRectangleIrregularGrid02
Demonstrates how to use Rectangle.irregularGrid() to create a grid with varying column widths
and row heights. The widths and heights are specified as a list of 13 Double values, each
picked randomly between the values 1.0 and 4.0. This produces two types of columns and two
types of rows only: wide ones and narrow ones.
The program also demonstrates how to query a row() and a column() from a RectangleGrid instance,
both of which return a List<Rectangle>. Both Rectangle lists are rendered with translucent
colors, which makes the intersection of the column and the row slightly brighter.
primitives/DemoRectangleIrregularGrid
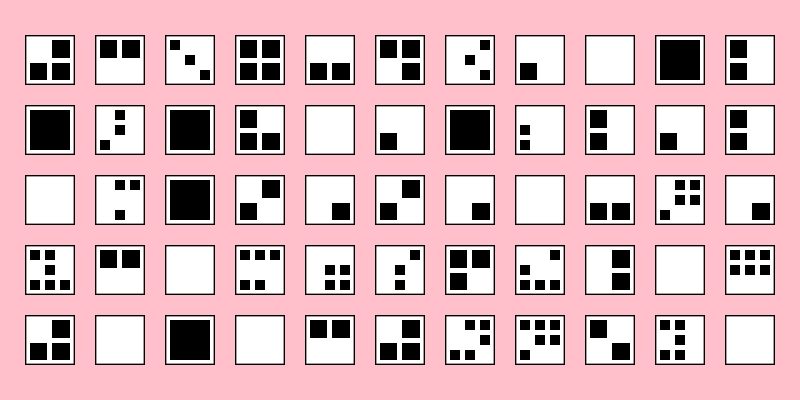
primitives/DemoRectanglePlace01
Demo for rendering a 10x10 grid of rectangles within the bounds of the canvas. Each rectangle's position is calculated relative to its anchors, filling the entire canvas with evenly placed items.
The rectangles are drawn using the default white color. The place function is applied to each
rectangle to position them dynamically based on their relative anchor points within the bounding area.
This serves as a demonstration of positioning and rendering shapes in a structured grid layout.
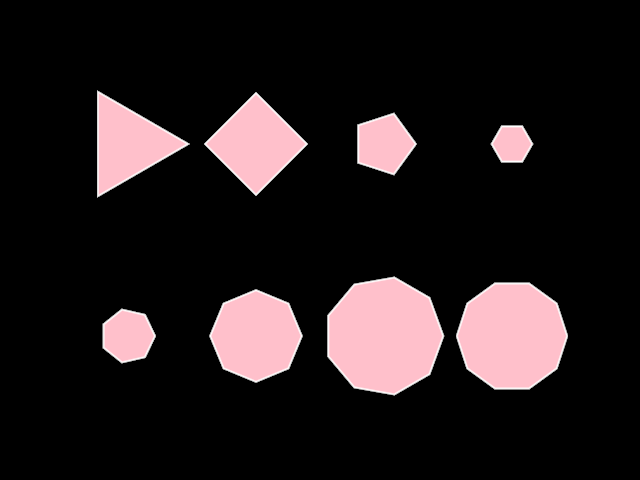
primitives/DemoRegularPolygon
primitives/DemoRegularStar01
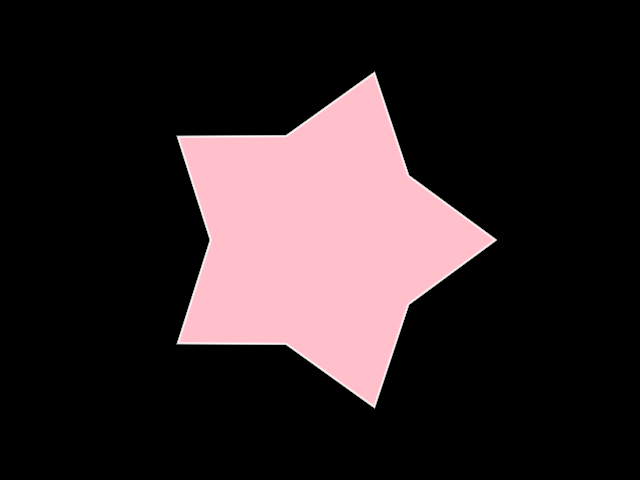
primitives/DemoRegularStar02
primitives/DemoRoundedRectangle
primitives/DemoSplit01
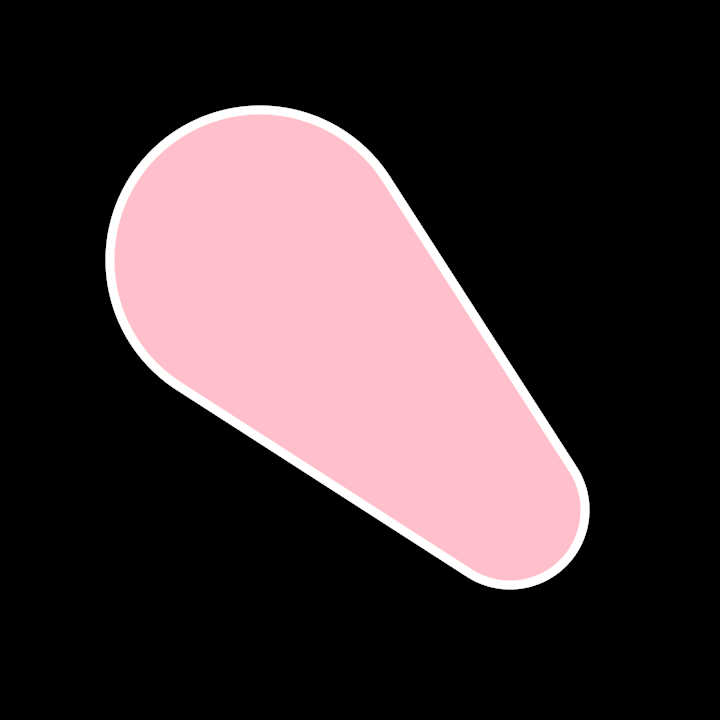
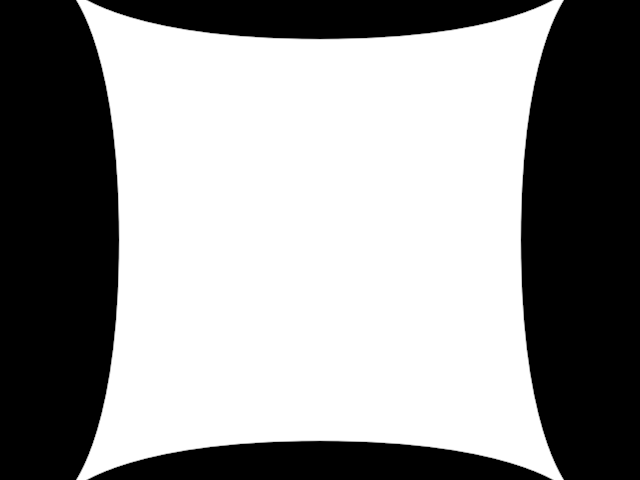
primitives/DemoTear01
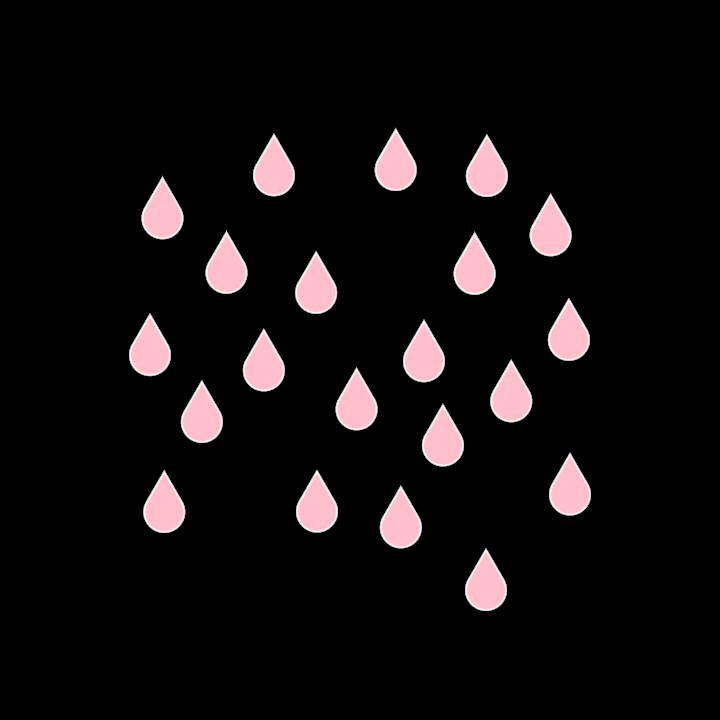
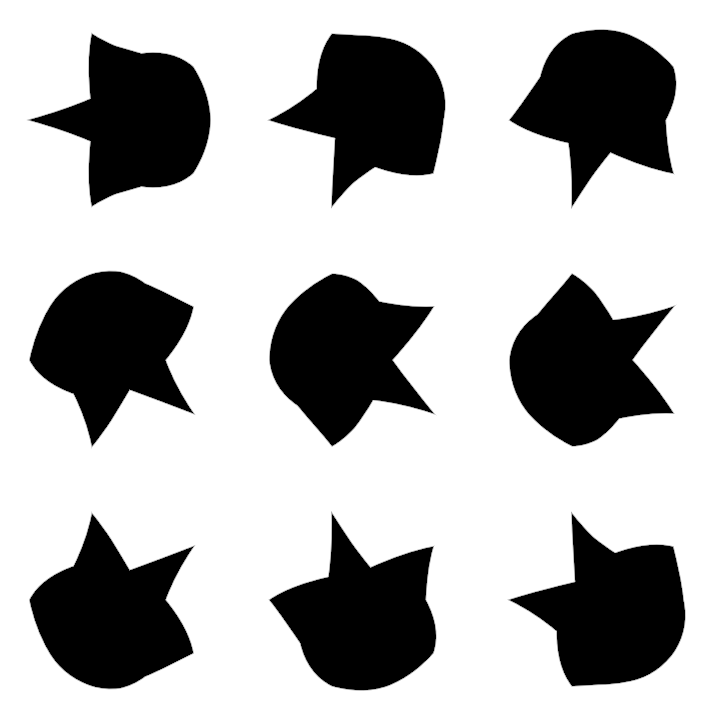
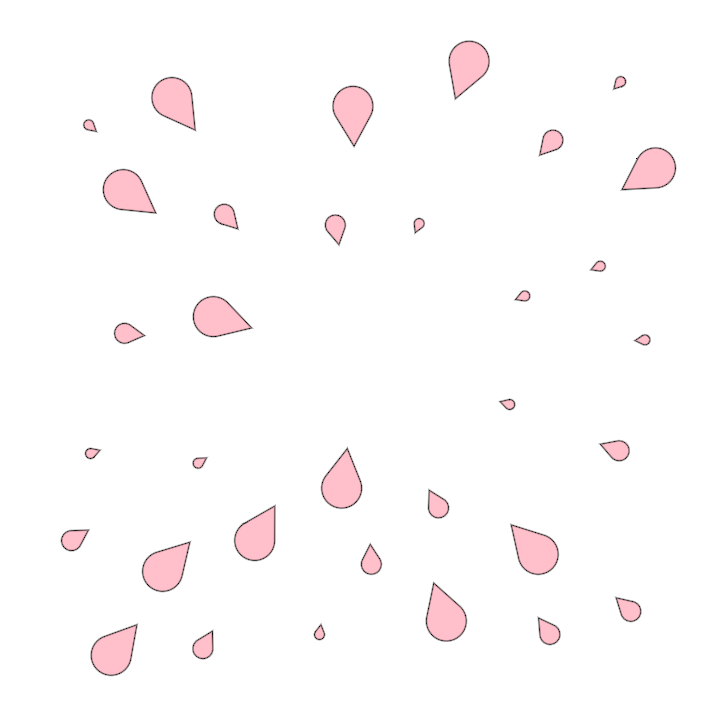
primitives/DemoTear02
Demonstrates the use of Tear() to create drop-like shapes out of a Vector2 point and a Circle.
The tear locations are calculated using the Rectangle.scatter() function. Locations near the
center of the window are filtered out.
The radii of each tear is randomly chosen between three values. The orientation of each tear is calculated by getting the normalized difference between the tear and the center of the window, making them look as being emitted at the center of the window.
rectify/DemoRectifiedContour01
rectify/DemoRectifiedContour02
rectify/DemoRectifiedContour03
rectify/DemoRectifiedContour04
rectify/DemoRectifiedPath3D01
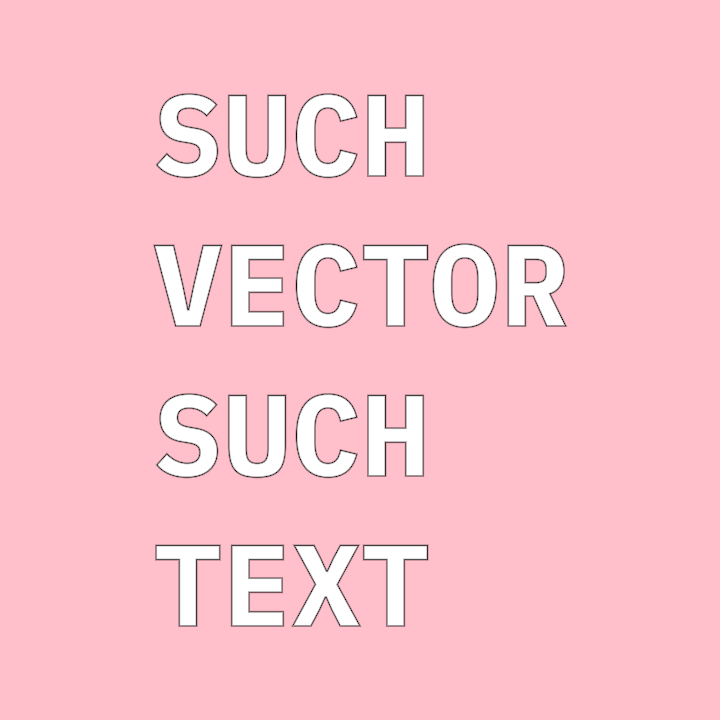
text/DemoText01
Demonstrates how to create vector-based shapes based on a font face file, a text and a size.
Try to zoom and pan with the 2D camera to verify that the text is actually rendered as vectors.
[shapesFromText] returns a List<Shape>, where each letter is an element in that list,
making it possible to style or manipulate each letter independently.
tunni/DemoTunniAdjuster01
tunni/DemoTunniPoint01
